Where Does the Next $100 Billion of AI Capex Actually Go?
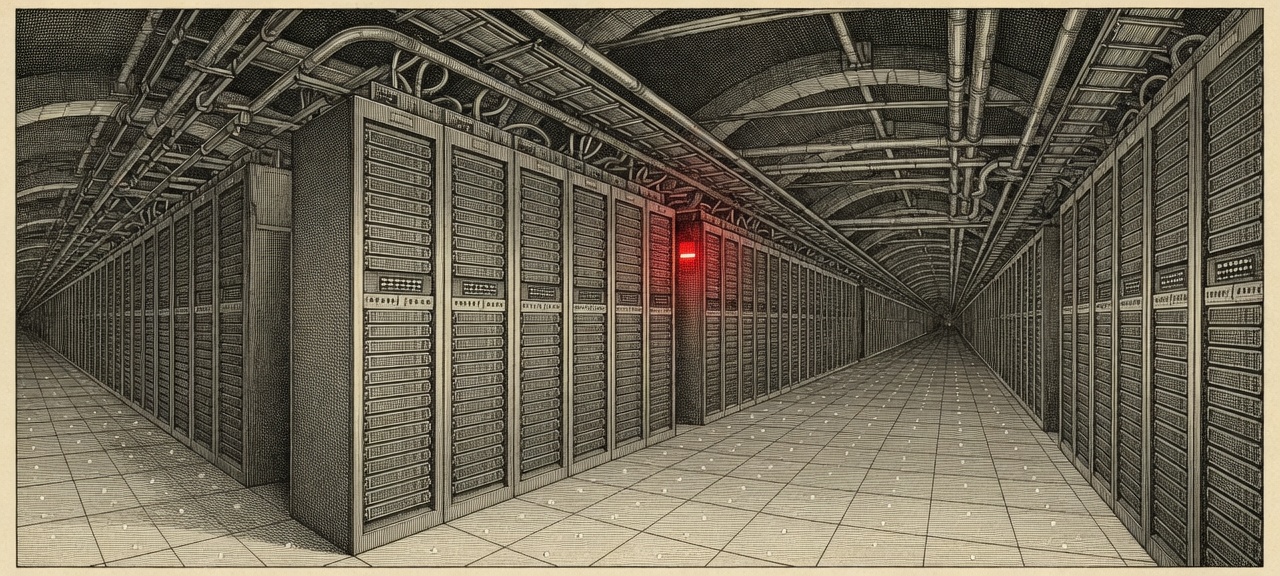
The market stares at NVIDIA and the handful of most expensive chips, and buys the entire AI datacenter as a single story. But the next hundred billion dollars has to travel through 18 layers, close to 300 distinct components and some 900 companies before it actually touches the ground. Most people see only the most conspicuous layer, and miss where the chain is genuinely throttled: power that cannot be connected, advanced packaging you cannot get a slot for, high-bandwidth memory controlled by three suppliers — and one layer of base material with effectively a single credible source. More important still: how much a company matters within the chain, and whether it is worth owning today, are frequently two different questions. This report takes the entire chain apart layer by layer; our own judgment follows below.
Take a real AI megafactory apart, and look at whose pocket each dollar lands in — and why "booking revenue" and "earning profit" are two completely different things.
Outside Abilene, Texas, there is a stretch of scrubland where, not long ago, there was nothing at all.
Today an AI campus called Stargate stands on it. No single company built it; several parties each own a segment. Lancium supplies the land, and holds an already-approved grid interconnection permit (the right to hook into the main grid — a queue that is itself very long). Crusoe, a private company, together with capital partners including Blue Owl, finances, builds and operates the facility. Oracle (ORCL) procures and operates the compute systems inside it, supplying that compute to OpenAI. OpenAI is the anchor customer consuming it. Power runs on two legs: a connection to the main grid, plus on-site generation. The point of self-generation is not to leave the grid behind, but to get electrons sooner and more reliably.
The buildings are packed with NVIDIA (NVDA) GB200 NVL72 racks — Blackwell-generation AI racks. Each rack draws so much power that conventional air conditioning simply cannot hold the line; liquid has to touch the silicon directly, or the chips throttle quickly and can trip into shutdown.
How big are the numbers? Disclosed first-phase financing is roughly $3.4bn. Once expanded to 1.2GW (gigawatts — a gigawatt is roughly the output of one large power station) across eight buildings, the full campus has been described as a partnership commitment of about $15bn. The distinction matters: phase one is billions; the campus is tens of billions. And several dozen campuses of this kind are under construction simultaneously, in the US and worldwide.
Which raises the question: these billions, these tens of billions — and, across the next few years, plausibly trillions in aggregate — where do they actually flow? Who gets paid first, who gets paid most, and who merely looks adjacent to the boom while earning nothing from it?
This article recommends no stock and sets no price target. It does something rarely attempted instead: it takes the entire AI datacenter chain — 18 layers, 292 components, roughly 900 listed companies — apart piece by piece and explains each one. As far as we know there is no comparably complete map of the AI compute supply chain in Chinese-language research (the full table sits in the appendix at the end; skip to it whenever you want to look something up). Once you have it, you can open any AI headline and immediately judge whether the company in question truly sits on the main artery of the money flow, or merely stands beside it catching reflected light.
The nine "independent chokepoints" share a common roster of companies and one common material — diversifying across them is double-counting the same bet
On the surface, transformers/power distribution, cooling fluids and datacenter siting look like three separate supply-chain bottlenecks. Dig in, and GE Vernova, Hitachi Energy and Siemens Energy appear simultaneously in the representative-company lists for Bottleneck 2 (high-voltage transformers) and Bottleneck 3 (power system integration). Which means:
- If you hold both a "transformer chokepoint beneficiary" and a "power system integration beneficiary" ETF or basket, the underlying holdings overlap heavily.
- Under a circular financing regime — where large datacenter projects are funded through the same banks and built by the same EPC contractors — these names correlate far more tightly than their on-paper diversification suggests.
- Genuine diversification has to happen at the industry-layer level, not merely across a count of company names.
Conclusion: when building AI infrastructure exposure, examine the underlying-company overlap across different "chokepoint themes" before sizing positions — rather than treating "9 chokepoints" as shorthand for "9 uncorrelated names to buy."
The "capacity relief" date sell-side notes take comfort in is precisely the trigger for their own short thesis
Numerous Wall Street notes frame the easing of CoWoS advanced packaging capacity (expected 2H 2026) and the loosening of HBM memory supply (expected post-2026) as good news for falling AI compute costs. But that same date fires two shocks in the opposite direction:
- For MU (Micron): an HBM supply ramp strips out the memory premium, and the pricing narrative for commodity DRAM and NAND compresses alongside it. As HBM shifts from scarce good to standard part, Micron's single biggest pricing narrative goes with it.
- For CRWV (CoreWeave): CoWoS relief means NVIDIA's new GPUs ship more freely and competition in compute leasing intensifies — compressing the premium CoreWeave earns from renting out scarce capacity.
- Compound shock: because both events land inside the same window, the "relief narrative" is in fact a double hit to these two categories of names, not the tailwind the market broadly assumes.
Conclusion: when a research note characterises a supply bottleneck's "relief date" as an unambiguously positive signal, the question to press is: which parts of the chain does that relief hurt? When a supply constraint disappears, the companies whose premium depended on it lose pricing power at the same moment.
I. From One Question to One Word: the Whole Chain Behind a Single AI Machine
You ask an AI on your phone: "Draft me an email requesting time off."
Three seconds later, the email appears. What happened in the physical world during those three seconds?
Your sentence first travels down fibre into some datacenter. There, one chip — or dozens — begins performing an astronomical volume of arithmetic. That is what AI fundamentally is: breaking every word you type into numbers, then using vast quantities of multiplication and addition to "guess" what the next word most likely is. This is inference: using a trained model to answer questions. Its counterpart is training: the months spent "teaching" the model in the first place.
To guess a single word, the chip must repeatedly pull the model's parameters out of the high-bandwidth memory (HBM — memory stacked directly against the chip, with extremely fast read/write) beside it. Dozens of chips then have to be lashed together by an extremely fast network into a single unit, like a class of students solving one large problem together, with nobody allowed to fall behind. All of this silicon generates heat as it computes — enough heat that liquid has to touch it to cool it down. And the precondition for all of it is that the building has sufficient, stable, cheap electricity.
So in order for that one word to appear, not a single link in the chain can be missing:
Power → silicon → memory → networking → cooling → software. Break any link and the email never arrives.
You very likely already own a slice of this build-out indirectly. The largest weights in the S&P 500 index fund you hold are precisely participants in this chain. Your retirement account and your index contributions have already put money into that scrubland outside Abilene. You have simply never taken it apart to look: there are eighteen links in this chain, each with its own roster of publicly listed companies — and what they earn, how they earn it, and how hard the earning is differ enormously.
What follows assembles those eighteen links into a factory map you can hold in your head.
Six links, none optional: what happens in the physical world every time you ask an AI something
Largest recurring datacenter cost
Largest single capital line item
Where the bandwidth ceiling sits
Source of cluster interconnect latency
Liquid cooling demand rising fast
Highest multiplier effect
Break any link and the email never arrives. ⚡ Power and silicon are flagged as today's global supply-chain bottlenecks.
II. The Panorama: Splitting the Factory into Eighteen Layers (Reader's Guide)
This section does one thing: hand you a map of the whole. We split the AI datacenter, from “who writes the cheque” to “who works the night shift”, into eighteen layers, and for each cover only three things: what it does, how easy money is to make there (a stable annuity, a cyclical business at the mercy of the market, or a chokepoint where a handful of firms set the terms), and whether it warrants your deeper attention. The specific components and companies beneath each layer are compiled in the companion table, 18 Layers · 292 Components. That table is the real substance of this report — 18 layers, 292 components, roughly 900 listed companies, with very broad coverage, there for you to navigate by. This section walks the skeleton first; turn to the full map when you need the detail.
III. Where the Money Goes: Two Waterfalls
When people hear that “an AI datacenter costs ten billion dollars”, the number is usually a blur. The first thing to do is pin down what that ten billion actually refers to.
To make the arithmetic legible, assume this phase of the Abilene campus costs exactly $10 billion ($10B) in total one-off investment to build. That is a round number chosen for ease of calculation, not Abilene's actual figure. The $10bn covers two things: the civil works of putting up the buildings, plus every piece of IT equipment loaded into them (silicon, servers, networking). This is the money it takes to go from nothing to powered-on, and the industry calls it build capex — the one-time outlay to build the plant and buy the equipment. It excludes the electricity bills, software fees and other recurring costs paid year after year once the campus is live. These two kinds of money behave completely differently, so we take them one table at a time.
Waterfall One: the One-off Cost of Getting Built
The $10bn falls like a waterfall, poured in at the top and cascading down layer by layer. The shares below are indicative ranges at industry-typical magnitudes, not Abilene's precise accounts. One widely cited breakdown — drawing on McKinsey's estimates for AI infrastructure in 2030 and Epoch AI's modelling of a 1GW plant — runs roughly as follows:
| Where the $10bn Broadly Goes | Order of Magnitude | Representative Recipients | Margin Quality |
|---|---|---|---|
| Technology and compute equipment (silicon, servers, networking) | ~60% | NVIDIA NVDA, Broadcom AVGO, Marvell MRVL | Extremely variable (see below) |
| Power, cooling and electrical (generation, transformation, UPS, liquid cooling) | ~25% | Eaton ETN, Vertiv VRT, GE Vernova GEV | Above average, and improving |
| Land, civil works and site development (siting, construction) | ~15% | EMCOR EME, Sterling STRL, Quanta PWR | Low to mid, but with long order visibility |
One distinction to keep straight: this is a breakdown of total investment, in which compute equipment takes the lion's share. If you look only at the construction portion — excluding the silicon itself — power, electrical and cooling account for a far larger share than the table suggests, because the deeper into physical infrastructure you go, the more absolutely dominant power and heat rejection become.
Waterfall Two: What Gets Paid Every Year After Energisation
Once the campus is running, the following payments go out month after month and year after year, and cannot stop while the plant is alive: electricity (to the generation operators), software and security subscriptions (names such as PLTR Palantir, CrowdStrike and Datadog, where software gross margins typically run 70%–80%), and equipment maintenance and spare-parts service (the aftermarket business of equipment vendors such as Vertiv and Caterpillar).
Separating the two waterfalls is what lets you see something most people run together: some companies earn the one-off lump from building the plant, while others earn the long, steady stream that flows for as long as the plant is alive. The latter are the ones we describe further on as able to charge twice.
Revenue Pool ≠ Profit Pool
Return now to the first waterfall, and to that last column on margin. It contains the single most important lesson in this article:
Revenue pool ≠ profit pool. The volume of money a company handles tells you nothing about the money it keeps.
Server assembly is the textbook case. Companies such as Dell (DELL) and Supermicro (SMCI) book frighteningly large revenue: an AI server stuffed with NVIDIA silicon sells for several hundred thousand dollars, and the top line swells accordingly. But what they actually do is put someone else's expensive chips into a metal box. On the AI server assembly step alone, gross margin can be as thin as roughly 5%; even Supermicro's company-level gross margin has recently run in the single digits to 10% range (specifically, about 9.9% in its most recent fiscal quarter). Of every $100 of revenue passing across their books, very little stays. (In fairness, Dell's overall gross margin is considerably higher, because it also sells storage and services rather than only assembling AI servers.) The money flows through their hands; it does not all land in their pockets.
Now look at NVIDIA. Company-level gross margin ran around 71% in its most recent fiscal year, and closer to 75% in the latest quarter: on the same $100 passing through, it keeps more than seventy. Why? Because it occupies a position nobody can route around. Its chips come with a software ecosystem called CUDA, on which AI programmers worldwide write their code; switching to another vendor's silicon means relearning the craft. That quality of being unavoidable is what investors call a moat. The deeper the moat, the stronger the pricing power, and the fatter the gross margin.
The Three Determinants of Bargaining Power
Why does the same category — hardware — pay single digits for assembly and seventy percent for NVIDIA? Not because silicon is inherently nobler than assembly, but because of a rule you can actually measure: bargaining power depends on three things — how hard you are to replace, how concentrated your suppliers are, and how concentrated your customers are.
Think of the salt seller and the vegetable seller in a market. The difference is not that salt outranks greens: that particular salt has a single source, switching suppliers means waiting six months, and salt buyers are numerous and fragmented — so the salt seller sets the terms. Vegetables are everywhere, three stalls are indistinguishable, and the biggest buyer is a canteen that negotiates hard — so the vegetable seller has no say. How much each layer of the AI chain earns comes down to the same question every time: can the customer manage without you?
Two Waterfalls: How the Money Flows and Who Retains the Most
← Left: build phase (one-off capital) | Right: operating phase (recurring revenue) →
Colour depth = share of capital retained at that layer · deep red / deep green = critical chokepoint · light = commodity layer (high volume, thin margin)
Keep that yardstick in mind; it applies to every company that follows.
IV. Who Gets Paid First, and Who Gets Paid Twice
Once you can see who earns the most, one further dimension matters just as much and is almost never discussed: timing. (A note: this section follows the money chronologically, in the order it leaves the account. The table in the previous section cut the same total along accounting categories. They are two different slices of one number.) The $10bn does not go out the door on a single day. Getting from scrubland to humming machines takes a year or two, sometimes longer, and the cash flows out in tranches, in sequence.
Walk Abilene through from nothing:
Tranche one goes to engineering design, land acquisition, and deposits on long-lead-time heavy equipment. Power transformers, for example, now take a year or two to arrive once ordered, so they have to be booked early with a deposit paid up front. That is why the order backlog of power equipment vendors (Eaton, Vertiv) — contracts signed but not yet delivered — is often already substantial before the plant is more than a drawing. They are the first in the chain to hear the money coming.
Tranche two goes to construction, electrical and cooling. Ground is broken, and the builders, the crews installing transformers and switchgear, and the teams running liquid-cooling pipework begin recognising revenue contract by contract. This is the densest stretch of the money flow.
Tranche three goes to compute and networking. Only once the buildings are up and power is live do NVIDIA's racks arrive in volume, and only then does spending on silicon, memory and networking get recognised at scale. (Operators chasing chip allocation may place orders far earlier to hold their place in the queue, so the sequence is not absolute.)
Tranche four goes to power, software, security and operations — the most attractive category of all, because it is paid month after month and year after year from the moment the campus energises, and cannot stop while the plant is alive. The market is willing to assign this kind of annuity business a steadier valuation.
And there is a fifth kind of money: getting paid a second time. Companies selling transformers or cooling systems earn once on the equipment sale; once that equipment is installed, years of maintenance, spare parts and service contracts are the second payment. It is the difference between buying an air conditioner once and then spending a decade on filters, compressor repairs and annual servicing. For a company like Vertiv (VRT), the aftermarket is often steadier and more profitable than selling new units. Companies that get paid twice have a structurally better business.
Lay those five payments along a timeline and you have a yardstick: when a new campus is announced, the first thing to show up in reported results is engineering and power equipment orders; then construction, electrical and cooling revenue; then silicon and networking; and only last the slow, steady stream of power, software and operations. This yardstick tells you whose numbers lead the cycle and whose lag it.
V. Four Clocks: Whichever Runs Slowest Holds the Pricing Power
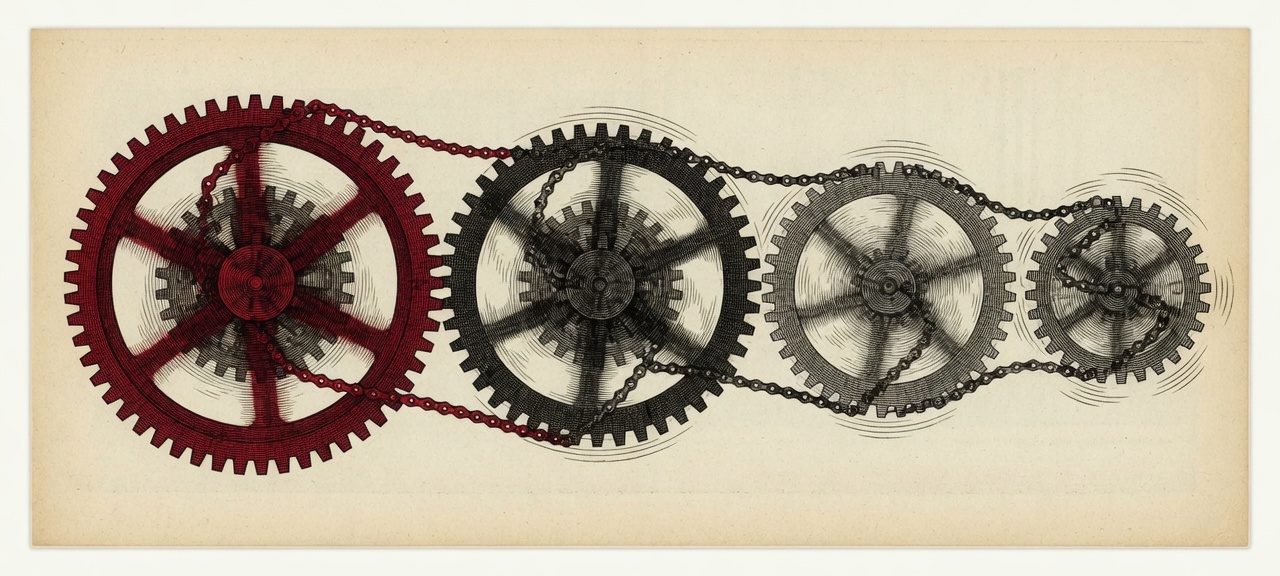
Money flows in sequence because four clocks inside this factory run at different speeds. First, correct an error many people make: “chips iterate quickly” and “chip capacity expands quickly” are two entirely different things. A new chip generation may arrive annually (product iteration), but getting fabs to actually turn out an additional batch of usable chips (capacity expansion) takes several years. The table below measures how long it takes to create incremental capacity, not how often the product refreshes.
| Clock | What It Governs | How Fast It Runs | Who Sits in the Way |
|---|---|---|---|
| Power / interconnection clock | How long it takes to get a campus energised | Typically 3 to 7+ years, varying widely by location | Generation, transformers, switchgear, grid interconnection |
| Chip supply clock | How long it takes to add a batch of usable chip capacity | Roughly 1 to 3+ years | Foundry, advanced packaging, HBM memory |
| System deployment clock | How long to build chips into racks and wire racks into clusters | Quarters to 1–2 years | Server assembly, networking, optical modules |
| Utilisation clock | How quickly it fills up and starts earning once built | Weeks to years | Software, operations, and inference demand itself |
Of these four clocks, across many of today's large US greenfield projects — built from scratch on empty land — the power clock is usually the slowest. To energise a campus you must file for interconnection, wait in the utility's queue, and build transformers (which themselves queue for a year or two). Every step is counted in years. Which explains why Abilene generates its own power: waiting on the municipal grid was not an option.
That said, “power is slowest” is not an iron law. If a project uses behind-the-meter generation (power produced and consumed inside the campus), has already locked in its interconnection permit, or is a retrofit of an existing building, the slowest link may be something else entirely. Change the setting and the order changes.
What does the slowest clock mean? It means pricing power. When everyone wants to build an AI plant, when electricity simply is not there and transformers simply have to be waited for, the companies that can supply power, build transformers or shorten the path to energisation hold temporary scarcity. They do not have to discount to win orders; customers queue for their product. This is the rule that runs through the entire report: in a system where everyone is sprinting and one link is the binding constraint, that link temporarily takes the largest share of the bargaining power. Which raises the next question: which link is binding hardest right now — and will it stay that way?
Four Clocks: Whichever Runs Slowest Holds the Pricing Power
6. Where the Bottlenecks Are, Where They Move Next, and the “Shelf Life” of a Shortage
This is the chapter to read slowly.
Start with where the binding constraint sits today. For many already-announced campuses, the tightest link has shifted from “are there enough chips” to “can we actually get power connected.” That is not to say chips are freely available — high-bandwidth memory and advanced packaging remain tight. It is to say that for projects where the silicon is ordered and the building can be put up, and the only missing piece is energisation, power and electrical equipment have become the hardest narrow point.
But there is a place where the market habitually pitches its focus one level too high, and it repays digging down layer by layer.
Below we take the most critical bottlenecks one at a time and work each to the bottom. Every one answers the same four questions: what it actually is, why it binds, how long it can bind, and what would break it. This section runs long, but it is the part of this report that is genuinely worth something.
Bottleneck 1: Power Simply Cannot Be Connected — the Shortage Is Not Generation, It Is the Queue
First, correct a common misconception. What the United States lacks is not only generation; it is the whole capability set required to plug a campus into the grid. Several constraints stack here at once: is there enough generation, enough transmission line, will the substation equipment arrive, and can the interconnection approval even get scheduled. A several-hundred-megawatt AI campus that wants power must first file an interconnection request with the utility, then queue, then go through grid impact studies, then build the associated substation and lines.
How long is that queue? Take the Texas grid (ERCOT, the body that manages the Texas power system): large-load interconnection requests waiting in the queue total roughly 410 GW, of which about 87% are data centres. Another frequently cited figure: for a generation project completed in 2023, the median time from application to actual interconnection was roughly five years. (That is generation interconnection data, not strictly equivalent to data centre load interconnection, but it illustrates the length of the queue just as well.)
What makes it worse is that the utilities themselves do not believe all these requests will materialise. ERCOT simply halves the volume of new data centre requests for planning purposes (planning at roughly 49.8%) and pushes every projected energisation date back by a uniform 180 days, because historically such projects have run late by an average of about 220 days. PJM, another major grid, mandates that large loads ramp over at least 36 months.
Why can money not solve it? Because the queue is blocked by two things money cannot move: physics (transformers, lines and the like have to be waited for, and land and rights of way have to be acquired) and regulation (study processes and approval schedules). No amount of money compresses a utility’s five-year study into three months, and none gets a transmission line crossing several counties permitted overnight.
So the truly scarce asset on this chain has never been GPUs. It is “a parcel of land that can genuinely be energised before 2027.” That also explains why Abilene chose to build its own power plant next door: waiting for the municipal grid was not an option.
Put it this way: your restaurant is packed and you are not short of chefs (generation) — you are short of the permit to connect the gas. The permit queue runs five years, and no amount of money buys you a place in line. You either wait, or you put a tank in the back yard (generate your own).
Bottleneck 2: Large Power Transformers — a Hard Shortage Money Cannot Move
Once you are in the power queue you still need a full equipment set to step high-voltage power down stage by stage and deliver it to the rack. The slowest-delivering and most constraining item is the large power transformer — the iron behemoth that takes hundreds of thousands of volts off the grid down to a voltage the campus can use. Lead times now run two to three years, and four hard constraints that money cannot move stack on top of one another:
First, transformer cores require a specialised grain-oriented electrical steel that only a handful of producers worldwide can make, and that steel is itself tight. Second, winding transformer coils is a craft: it takes several years to train a skilled winder, and because grid investment has been essentially flat for the past two decades, the trained workforce has long since shrunk. With demand suddenly doubling, people cannot be replaced in a year or two. Third, finished units must be dielectrically verified on dedicated high-voltage test benches, and those test benches are scarce in their own right. Fourth, and most important: after a long stretch of slow grid load growth, the entire supply chain squeezed out its spare capacity — and now that AI has lifted demand overnight, the industry has almost no idle capacity left to absorb it.
How slow, concretely? Large power transformer lead times have stretched beyond 36 months, and longer still for the largest ratings. Several North American leaders (Siemens Energy, Hitachi Energy and others) are each expanding capacity, with industry estimates putting combined investment at roughly $2bn; that capacity comes online around 2028 and, when it arrives, what it delivers is “lead times stop lengthening,” not “spot availability is suddenly ample.” Extrapolating from the current pace, this shortage most likely stays hard past 2028 — a base-case judgement, not a certainty.
What would break it? Watch one signal: whether lead times peak and stabilise — not whether spot supply looks better. If lead times are still lengthening in 2027, capacity has not kept up at all.
Think of it as commissioning a hand-forged specialty part: the only furnace that smelts that steel is booked out two years, and the one master craftsman who can forge the part is close to retirement with no successor. At that point money is useless — it will not shorten the furnace queue and it will not conjure up a craftsman.
Representative companies: the high-voltage equipment set is made by Hitachi Energy, Siemens Energy, GE Vernova (GEV), Eaton (ETN) and ABB — the same small group runs from the highest-voltage transmission gear all the way down to the switchgear inside the campus. Almost every high-voltage step is this same cohort, new entrants find it very hard to break in, and that is precisely where their pricing power comes from.
Bottleneck 3: Generation Itself, and Four Escape Routes to Self-Supply — on Wildly Different Clocks
With interconnection queues running five years, many campuses simply generate their own power (the industry term is “behind-the-meter” supply). But there are four routes to self-supply, and the market routinely lumps them together when in fact their credibility and their usable timing are worlds apart:
- Gas turbines: the most realistic large-scale near-term supplement. But market leader GE Vernova is sold out through 2028, with under 10 GW of capacity that can be freed up by 2029 — and burning your own gas brings new complications: you need a gas pipeline connection, you need emissions and environmental permits, and you add single-plant failure risk that can take the whole site down.
- Restarting retired nuclear plants: genuinely real (Microsoft signed a twenty-year agreement with Constellation to restart a unit at Three Mile Island). But the business has a hard ceiling: only so many old units in the United States can be restarted at all, and once they are done, they are done — you cannot scale it up at will the way you can build a factory. So it commands a scarcity premium, but it is not replicable.
- Solid-oxide fuel cells (the kind Bloom Energy makes): one of the few scalable options among the four that can be installed and generating power now. (Reciprocating gas gensets and small gas turbines can also be deployed relatively quickly at suitable sites.) But in a world where grid interconnection takes five years, the simple fact of “power available today” is itself scarce — a point the market routinely underrates.
- Small modular reactors (SMRs): the sexiest story and the press’s favourite. But it is mostly a post-2030 proposition, with next to no near-term contribution to the power shortfall of the next year or two.
Here lies the single biggest misjudgement on offer: treating an option still on the drawing board, like SMRs, as a cure for today’s power shortfall — and paying a price that assumes immediate delivery.
Say the town’s gas hook-up has a five-year wait. One person buys an off-the-shelf generator and runs it the same day (fuel cells). Another restarts the old boiler in the yard (nuclear restart — but not every household has an old boiler). A third orders a micro reactor still on the drawing board (SMR, arriving in three years). Buying the blueprint as though it were available today is the most expensive of those mistakes.
Bottleneck 4: Advanced Packaging (CoWoS) — a Capacity Shortage That Will Ease
Now cross from power to the silicon side. A high-end AI chip is not a single slab; it is a compute die and several high-bandwidth memory stacks assembled and interconnected at extreme precision, rather like Lego. That stack-and-connect step is advanced packaging, and the top tier used by the highest-end AI chips is known in the industry as CoWoS — with capacity highly concentrated at TSMC.
Why does it bind? Because assembling multiple dies together at high yield is hard: hard on yield, hard on the substrate underneath, hard on customer qualification. TSMC devotes 10% to 20% of its capex specifically to packaging, and supply-chain estimates put NVIDIA alone at over 60% of the booked capacity (an industry estimate, not TSMC disclosure).
But there is one critical difference from transformers: TSMC is actively expanding capacity at scale. Industry estimates have CoWoS capacity climbing from roughly 35,000 wafers per month in 2024 toward 90,000–130,000 per month by end-2026 (note that this is a range, not a settled figure). So a reasonable judgement is that mainstream capacity eases materially in 2H26, while the very highest-end, largest-format packaging tier — which yields fewer finished units per wafer and carries a qualification cycle — may stay tight into 2027.
CoWoS is therefore not “permanently short” but “easing, just unevenly.” This matters enormously: if you pay a permanent-moat price for a stock riding the CoWoS windfall, you are buying a self-resolving shortage as though it were a structural monopoly. That is the easiest trap to fall into with this class of bottleneck.
Bottleneck 5: HBM High-Bandwidth Memory — Stickier Than CoWoS
Sitting right alongside packaging is high-bandwidth memory (HBM) — as described earlier, the memory stacked directly against the compute die with extremely fast read/write, and the lifeblood of AI inference. It belongs to the same “capacity can expand, but slowly” class as CoWoS, yet it is stickier, for three reasons.
First, to store an equivalent bit, HBM consumes roughly three times the silicon of ordinary memory (DDR5) — it is inherently more capacity-hungry. Second, it is built by stacking many memory dies and drilling through-connections between them, and stacking yield is very difficult. Third, and hardest of all: for NVIDIA to use a given supplier’s HBM, the part must clear an extraordinarily long and demanding qualification (verified item by item, by product and by platform, before anyone dares go to volume). Those three in combination leave just three suppliers worldwide able to ship reliably — SK hynix, Samsung and Micron (MU) — with SK hynix alone at roughly 60% of shipment volume (2Q25 data).
How long can it bind? Bit supply is indeed growing quickly, but the three factors above (3x the silicon, stacking yield, punishing qualification) keep usable high-end HBM tight beyond 2026 — Micron has already effectively locked up its full-year 2026 HBM capacity under price-and-volume agreements. So it loosens more slowly and stickily than CoWoS, but it is equally not a permanent monopoly: the moment a usable fourth supplier appears, or a new generation reduces silicon consumed per bit, that wall starts to give.
Bottleneck 6: One Film on the Packaging Substrate — an MSG Company Constrains the Whole Industry
This is the most overlooked and yet hardest single point on the entire chain. Once a chip is packaged, it must be mounted on something called a packaging substrate (FCBGA — the board that carries the die and connects it to the outside world), and making that substrate requires a build-up film called ABF. The overwhelming majority of that film worldwide is supplied by a single Japanese company, Ajinomoto (which reports share above 90%, making it the de facto industry standard). Yes — the MSG company.
Why only them? Because this is a proprietary formulation plus decades of accumulated process know-how; you cannot simply spend money and reproduce thirty years of Ajinomoto’s learning. Substrate capacity itself (made by Unimicron, Ibiden, AT&S and a few others) can still be expanded gradually — but as long as this film stays concentrated in one pair of hands, the entire high-end packaging chain carries a single point that is extremely hard to substitute.
Think of it this way: every Michelin-starred chef in the world (NVIDIA, TSMC) is fighting over kitchen space, but the one specialty sauce every one of them uses is made by a single small workshop. Build all the kitchens you like — if the sauce workshop does not nod, the dishes still do not come out complete.
Bottleneck 7: The “Japan Wall” at the Very Top — the Deepest Moat, and the Least Discussed
ABF film is not an isolated case. The further upstream you travel, the more you run into an invisible wall of near-monopolies held almost entirely by Japanese (and a few Korean) companies. It is among the deepest-moated segments on the entire chain:
- The most advanced lithography (EUV, extreme ultraviolet lithography — the equipment required to make the most advanced chips): only one company in the world, ASML of the Netherlands, can build it. The wall is twenty years of accumulated technology, and a new challenger has to close a twenty-year gap before it can even enter.
- Silicon wafers (the round base plate chips are built on): the high-end market is highly concentrated in two Japanese companies, Shin-Etsu Chemical and SUMCO.
- Photoresist and mask blanks (the photosensitive materials and master plates used in lithography): again a short list of Japanese firms — Tokyo Ohka, Shin-Etsu, AGC and Hoya.
These are among the hardest moats on the chain for capital to breach. Unlike NVIDIA — whose CUDA ecosystem will be gradually eroded by major customers’ in-house silicon — these upstream links leave downstream customers with essentially no second supplier to switch to.
But here an honest caveat, and one most people miss: the deepest moat is not the same as the best stock. These upstream materials companies run a volume-times-price business; they are fundamentally cyclical-cum-defensive names that ride the semiconductor cycle up and down, with far less operating leverage than a platform like NVIDIA. Their defensive qualities are formidable, but you cannot buy them on an AI-growth framework — you need a cyclical-and-defensive one. The highest wall does not mean the fastest climb.
Bottleneck 8: Optical Modules — the Class Most Likely to Glut, Where Volume Does Not Mean Profit
Turn to the networking side and optical modules (when an electrical signal cannot travel far enough, you send it as light; an optical module is the device that converts between the two). It is an instructive counter-example: volume explodes, gross margin stays thinnest.
Why? Because the closer you move toward the module assembly end, the thinner the margin gets. Coherent (COHR) and Lumentum (LITE), the companies doing this work, run company-wide gross margins in the region of 30%–40% — already well below NVIDIA’s 70% or TSMC’s 60% — while the furthest-downstream server assembly step is thinner still, in the single digits to about 10%. The point is not any one precise number but the pattern: the closer a link sits to assembly, the thinner the profit, and exploding volume does not mean exploding money. (Shipments of high-speed optical modules at 800G and above run at roughly 2.6x 2025 levels in 2026 — but large volume is not thick profit.)
What is genuinely scarce is not the assembled module but the laser chip upstream of it (the EML/CW laser sources grown on indium phosphide, InP, substrates). And that upstream shortage is easing: industry research house LightCounting reports that InP laser capacity is catching up through 2026 and may even tip into oversupply.
So the optical module chain is entirely unlike HBM above: it is closer to a commodity-cyclical shortage, where capital arrives fast and may well overshoot. That sets a trap. When optical modules are earning spectacular money on shortage and the shares have been bid up hard, the market extrapolates today’s tightness indefinitely — and once upstream capacity lands and prices roll over, profits and multiples fall together. The signal to watch is simple: new InP capacity coming online plus spot prices for high-speed modules beginning to slide is the first symptom of oversupply.
Bottleneck 9: The “Last Segment” of Cooling — the Hard Part Is Not Metal, It Is a Qualified Loop
The final bottleneck is cooling. Everyone is talking about liquid cooling, but what actually binds inside liquid cooling is not the broad direction of whether to adopt it — it is the system that delivers coolant precisely and reliably to every single chip and takes it back again: coolant distribution units (CDUs), the various pipework, and a small part called a quick-disconnect coupling (a fitting that seals on insertion and does not leak). A high-density rack contains dozens of these couplings or more, and a single leaking connection can take the whole rack offline or even destroy several million dollars of silicon inside it.
The difficulty here is counter-intuitive: the hard part is not fabricating the metal parts, it is getting the whole loop through demanding qualification (uniform flow, material compatibility, zero leakage, serviceability). For example, one Eaton coolant distribution unit is rated at 2.3 MW on an 8°C approach temperature but only 1.15 MW on a 4°C approach — once the nameplate figure leaves the operating conditions it was validated under, it means nothing. What binds at this link is therefore qualified capacity, not metal capacity.
The liquid cooling market as a whole grows from roughly $3bn in 2025 toward about $7bn by 2029, but that growth relieves “can it be built,” not “can it be qualified.” The system builders include Vertiv (VRT) and Eaton (ETN), with Amphenol (APH), Parker (PH) and nVent (NVT) among those making the quick-disconnects. This link currently sits at an early stage — reference designs have only just appeared and approved-vendor lists are still lengthening — and whoever secures this new position before industry standards harden gets a window of qualification premium.
Nine Bottlenecks in One Sentence: Separate “Will Ease” from “Cannot Be Replaced”
Having dug through all nine, you can feel the sentence we most want to leave you with:
The media reports shortages. We report when shortages end.
Because it helps you avoid the most expensive trap in AI investing: paying a “shortage forever” price for a link where the shortage is about to end. Sort the nine bottlenecks above by shelf life and three classes emerge.
Class one: cannot be replaced (structural / IP-protected), the longest shelf life. EUV lithography (only ASML can build it), ABF film (Ajinomoto above 90% share), silicon wafers (highly concentrated in Shin-Etsu and SUMCO). New entrants find it extremely hard to break in, these shortages persist for a considerable time, and they deserve moat valuations — but remember that the upstream materials names among them are fundamentally cyclical-cum-defensive assets.
Class two: will ease, but unevenly (capacity-constrained), and the easiest to misread. Large transformers, CoWoS advanced packaging and HBM all sit here. Capacity can expand, but it has to clear qualification, ramp yield and find skilled labour, so it expands slowly and unevenly. The key is not to treat these as permanent monopolies: they will loosen, just in a particular order and at different speeds (mainstream CoWoS eases first in 2H26 with the high end running to 2027; transformers not until after 2028; HBM stickier still).
Class three: will glut (commodity-cyclical), the shortest shelf life and the deepest trap. Optical modules and some general-purpose components belong here. Demand spikes, prices rise, capital floods in, and a year or two later supply catches up and the shortage disappears. You think you are buying long-term growth; in fact you are buying a windfall that will be destroyed by the very capacity it attracted — and buying it at its most expensive moment.
Finally, remember: bottlenecks move. Today the hardest narrow point is power and electrical equipment. But suppose transformer capacity lands in 2028 and the power problem eases — the hardest narrow point then migrates to whatever link is next-slowest, which might be some critical material, or it might be skilled construction labour. Reading a supply chain is not only about who is short now; it is about when today’s shortage stops being short, and who is short next when it does.
Nine Chokepoints: Speed of Relief and Shelf Life
Bar length = estimated shelf life; colour = shortage type; ordered from fastest to ease to hardest to eliminate
Highest glut risk
TSMC expanding fast
CDU qualification barrier
Three-supplier qualification wall
3 yr+ lead times, capacity being built
Ajinomoto single-point monopoly
Multi-year permitting backlog
Gas fast / nuclear very slow
Decades of IP and process know-how
Source: author’s analysis and synthesis; shelf-life figures are the author’s estimates, not official forecasts
This chapter has worked all nine bottlenecks to the bottom, but for exactly which companies stand behind each bottleneck layer, the appendix at the end of the report lists them in full for the relevant layers — you can work down the list name by name.
7. Is the Demand Real? The Chain’s Deepest Question Mark
Every piece of analysis above rests on one assumption: that the money underneath — hundreds of billions of dollars a year, trillions in aggregate — is real and sustainable. Is it?
Let us be precise about this: the honest bear case is not “demand is fake and the bubble is about to burst.” There is no public evidence today of widespread idle compute or collapsing usage; real AI consumption is still growing. Between end-2022 and end-2024, the cost of running one million inference tokens fell from roughly $20 to about $0.07 — a decline of some 280x — and cheapness has pulled in a large volume of genuine demand. What deserves real concern is two other things, both subtler and much harder to refute.
First, circular financing. Break those hundreds of billions apart and one portion is carried by hyperscalers funding capex out of real cloud revenue — hard foundations. But another portion is carried by a financing structure whose parties bite down on one another. The cleanest example is the neocloud CoreWeave: it pledges the GPUs it owns as collateral to borrow, then spends the proceeds on more GPUs. In a single quarter its capex (roughly $6.8bn) ran at more than three times revenue (roughly $2.1bn), with sizeable depreciation and interest on the books — while NVIDIA is simultaneously its supplier, its shareholder, and its ecosystem partner. The implication: the supplier’s profit, the borrower’s collateral, and the customer’s order book strengthen together, and can weaken together. This is not an allegation that anyone is cooking the books; it is an observation that the risks inside this system are highly correlated. Picture a village where the seed merchant lends farmers the money to buy his seed, takes an equity stake in their land, and signs an offtake contract for the harvest. In good years all three parties make money; in a bad harvest all three blow up at once, because they were never really three things.
Second, depreciation mismatch — the deeper layer. Those AI chips, hundreds of thousands of dollars apiece, are depreciated on the books over five to six years (Microsoft, Meta and Google have all extended server useful lives in recent years, which mechanically suppresses current-period depreciation and lifts reported profit; the filings do not state a motive). The problem is that a frontier training chip’s genuine high-value life may be only two or three years. When the next generation arrives with materially better compute per watt and per dollar, the premium on the old silicon is competed away. Amortised over six years on the books, obsolete in three in practice — that gap is the deepest short thesis on the whole chain.
How do the bulls answer? The bull case requires believing in something called the “value cascade.” Older chips may no longer suit frontier training, but they can be stepped down the stack — retired into inference, fine-tuning and low-priced workloads — and keep generating cash across the full accounting life. Put it this way: you depreciate over six years a machine that is really obsolete in three, and the first three years of reported profit look excellent. From year four, either that old machine genuinely redeploys onto lighter work and keeps earning (bulls are right), or it is scrap metal still being amortised on the balance sheet (bears are right).
So the conclusion of this chapter is not “run for the exit” — it is to hand you the right question to watch. The question is not whether demand disappears (near term, it will not), but whether this extraordinary volume of investment can ultimately earn an adequate return. That in turn depends on whether the value cascade holds, how fast token prices fall, and whether that correlated financing complex comes under pressure all at once at some point. All of it can be tested quarter by quarter — and it is the single thing on this chain most worth tracking over the long run.
8. Who Is Really Doing AI and Who Is Just Riding the Word: An Evidence Ladder
By now you can read how the money flows, who sits on the critical chokepoints, how long the shortages can last, and what the deepest question mark over demand really is. But open the news in the real world and every screen is full of companies “fully embracing AI.” How do you tell which ones are real and which have simply printed the letters “AI” on the cover of their annual report?
We will not hand you a single-veto checklist — that would unfairly condemn asset-light software companies and wrongly kill off firms barred by NDA from naming customers. Instead, here is an evidence ladder with six rungs: the higher you climb, the harder the evidence. Simply listing six questions would say nothing, so each rung comes with a concrete way to spot it at a glance and a real-world contrast. First, one governing principle: “not disclosed” and “no evidence” are two different things. A company that does not break out AI revenue is not thereby a pretender — it simply has not climbed to that rung yet.
Rung one, and the hardest: it discloses AI revenue separately, and that line is both large and growing fast. How to check: open the latest quarterly report and look for a standalone line reading “data centre revenue” or “AI revenue,” with a year-on-year growth rate attached. NVIDIA tells you every quarter exactly what data centre revenue was and how much it grew; Broadcom breaks out “AI semiconductor revenue” on its own. A company willing to carve out AI revenue and put a growth rate next to it is, as a rule, not faking. The converse: a company where you can comb the whole filing without finding a single AI revenue figure, but which repeats “we are seeing strong AI demand” on the call, has not reached rung one.
Rung two: it does not break out AI revenue, but it has signed large orders or quantifiable real-world volumes. How to check: look for verifiable hard numbers — backlog, signed contracts, actual shipments or usage. A power-equipment company saying “data centre orders up 240% year on year, record backlog,” or an optical module maker saying “800G module shipments doubled,” is worth far more than “demand is good.” Watch for the most common sleight of hand: talking only about a “healthy sales pipeline” or “enthusiastic inbound enquiries.” A pipeline is not an order and an enquiry is not revenue; dressing up “might buy” as “has bought” is the favourite rhetorical device of the AI-adjacent.
Rung three: the AI business has its own gross margin and unit economics, proving it actually makes money rather than buying revenue. How to check: adjacency is not enough — ask whether this line is profitable. A superb negative example is the server assembly step discussed earlier. Its AI revenue purity is extremely high (almost every order is an AI order), yet that process step earns only single-digit gross margin: Super Micro (SMCI) reported company-wide gross margin of just 9.9% in its most recent fiscal quarter, with revenue through the roof and profit not following. Conversely, a company that can articulate “here is my AI gross margin, here is what I earn per unit” has demonstrated that it stands on the profit side of the ledger, not merely the revenue side.
Rung four: where its business genuinely requires it, it has committed real capital to capacity or R&D. How to check: this rung must be applied to the right category. Asset-heavy companies (foundries, equipment, power, operators) should be expanding capacity and running large capex; talk without spend is empty. But an asset-light software company should not be posting heavy capacity spend, and docking it points for “not spending on expansion” does it an injustice. The question is therefore: for the category that ought to spend, did it actually spend — and for the category that ought not to, do not force the test.
Rung five: third-party corroboration from customers or suppliers. How to check: another company’s filings and another company’s earnings call naming it is always more credible than its own promotion. A custom-silicon design house claiming a large order from a major customer need not be taken entirely at face value; but if that customer — say a hyperscaler — names the partnership in its own results, credibility jumps a level immediately. Cross-verification always beats self-report.
Rung six, the softest — yet the easiest place to catch a fake: has management told a consistent story across multiple quarters? How to check: pull the last four or five earnings calls and read them side by side. Companies genuinely doing AI get more specific over time, with finer-grained numbers each quarter. Companies riding the word tend to change the framing every quarter, grow vaguer as they go, and quietly stop mentioning the metric they touted last quarter. A drifting narrative is the most basic — and most reliable — danger signal there is.
How to use the ladder, in one line: it is not there to help you find winners, it is there to help you clear mines. AI is the biggest narrative of the era, and the bigger the narrative, the more people want a free ride. The more a company puts “AI” in every sentence while failing to climb even one rung (no revenue figure, no orders, no gross margin, no third-party corroboration, and a story that keeps shifting), the more wary you should be. Conversely, the companies genuinely sitting on the main artery of the cash flow often feel no need to keep stressing their AI exposure — the numbers in their filings speak for them. Apply these six rungs to any “AI concept stock” and exactly which rung it stands on becomes obvious at a glance.
The Six-Rung Evidence Ladder: Real AI vs. Riding the Word
The lower the rung, the harder it is to fake → start verifying at rung one and work upward as corroboration
9. Winners, Losers and Three Scenarios
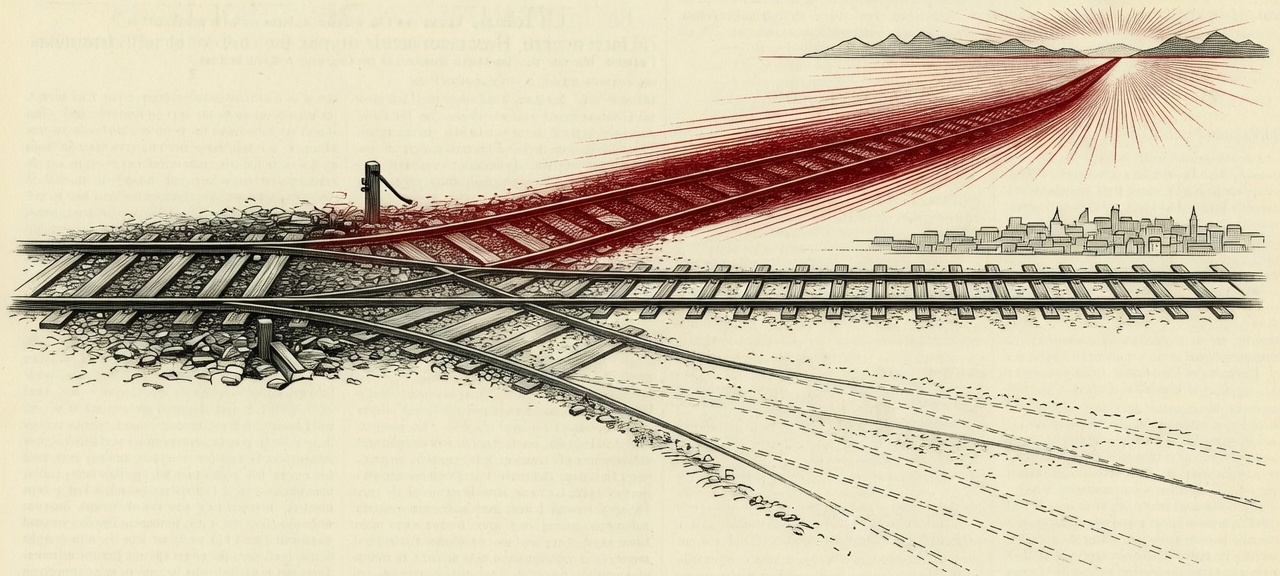
On any supply chain, for every party eating well there is a party taking the hit. Start with the casualty list: under what conditions does each one fall first?
- If power stays unavailable: the operators that have already bought their chips but cannot switch them on for lack of power and cooling suffer first. Chips worth hundreds of thousands of dollars each, stacked in an unfinished shell, depreciating every day and earning nothing.
- If capex slows: once the hyperscalers tap the brakes, the first to feel the chill are the links that live off new-build projects — construction, electrical, cooling, assembly. Their revenue is project-based; when projects stop, revenue stops immediately.
- If campuses get “stranded”: contracts signed in volume, but any one of money, power or silicon failing to arrive — heavy capital committed with returns pushed out indefinitely. The asset managers financing it and the highly leveraged operators come under pressure (which connects straight back to the circular-financing risk in Chapter 7).
- If inventory builds: if demand disappoints, the highly cyclical links — memory, certain components — are the most exposed to a pile-up: undersupplied in the boom, and hit with collapsing prices when it turns.
Understand the casualty logic and you can reason through three futures. Note carefully: these are not predictions. They are three maps, so that whichever case materialises you know where the money moves.
Scenario one: compute keeps accelerating. Demand keeps exploding, everyone builds flat out, and the physical bottlenecks call the shots: power, electrical gear, advanced packaging, cooling, optical modules — whoever is tightest earns the most. The risk is that valuations get pushed too far, so that even a modest slowdown in pace produces a violent de-rating.
Scenario two: capex enters a digestion phase. The building is largely done and the hyperscalers pivot to filling and running the capacity they already have. Money shifts from “building the factory” to “using the factory”: software, operations and efficiency optimisation come to the fore, while hardware companies dependent purely on new-build orders see order books weaken. The winners shift from those selling bricks to those managing the building.
Scenario three: inference gets cheaper. Here lies the fork most easily reasoned backwards, so think it through carefully: cheaper does not mean less demand. Once prices fall, two opposite outcomes are possible. Either the savings outrun the incremental usage, the profit pool for compute hardware is compressed, and value migrates toward the application layer — or cheapness detonates demand, everyone uses AI far more aggressively, and aggregate compute demand keeps climbing. Historically, many technologies have taken the second path: when something gets cheap, consumption explodes. Which one it is here is the single biggest open question in this entire story. Whatever you do, do not reflexively conclude from “inference is getting cheaper” that “infrastructure demand must shrink.”
The three maps differ, but one statement holds across all three scenarios — and it is the judgement we most want you to take away:
How “important” a company is to AI and whether it is “worth buying” are two different questions. Some companies operate quietly yet sit on the narrowest opening in the whole chain and are enormously important to the industry — but buy in at its most expensive point and, however secure that chokepoint, the investment can still lose money. Conversely, some companies tell a thunderous story at a rich valuation while occupying no critical position at all. Your job is not to guess which scenario comes true; it is to ask two separate questions: does this company actually sit on a chokepoint? And at today’s price, has that advantage already been fully discounted in advance?
Three Scenarios: Where the Money Flows in Each
Demand keeps exploding; the physical bottlenecks call the shots
- Winners: power / electrical equipment (transformers, GEV, ETN, SU.PA)
- Winners: advanced packaging (TSM CoWoS), cooling (VRT CDUs), optical modules
- Risk: valuations pushed too far; any easing of pace brings a violent de-rating
Building largely done; hyperscalers pivot to filling the capacity already built
- Winners: software / operations / efficiency optimisation (NOW, DDOG, NET and peers)
- Losers: hardware companies dependent purely on new-build orders
- Money shifts from “building the factory” to “using the factory”
The critical fork: cheaper ≠ less demand
- Outcome A: compute demand explodes instead (cheaper → more usage; the historical pattern)
- Outcome B: value migrates to the application layer, compressing infrastructure profits
- The two outcomes point in opposite directions — the largest open question of all
Whichever scenario plays out, ask two questions (1) Does this company actually sit on a chokepoint? (2) At today’s price, has that advantage already been discounted in advance?
10. Important ≠ Worth Buying: A “Chokepoint vs. Value” Scorecard
Finally, one table to put the whole report to work. The dozen-odd companies below are not a recommended list — quite the opposite. The table exists to teach you not to read inclusion as endorsement. We have deliberately picked several mutually contradictory types so you can see that “hard chokepoint,” “AI purity” and “worth buying” are frequently not the same thing.
Four dimensions: the relevant chokepoint (which link it sits on), AI revenue purity (how much of its revenue is genuinely tied to AI), positional strength (whether it holds real pricing power at that link), and current evidence / principal counter-evidence.
| Company | Relevant chokepoint | AI purity | Positional strength | Current evidence / principal counter-evidence |
|---|---|---|---|---|
| NVIDIA NVDA | Compute silicon + the CUDA ecosystem | High | Strong | Evidence: exceptional gross margin, deep ecosystem lock-in. Counter: still carries other businesses such as gaming; major customers’ in-house silicon is closing in |
| TSMC TSM | Wafer foundry + advanced packaging | Medium | Strong | Evidence: the highest-end AI chips cannot route around it. Counter: pure foundry — if downstream cools, it takes the cycle too |
| ASML ASML | EUV lithography | Medium | Strong | Evidence: sole supplier worldwide, the deepest moat on the chain. Counter: its customers are every chipmaker, and orders are lumpy |
| Micron MU | HBM high-bandwidth memory | Medium | Medium | Evidence: the HBM qualification wall holds rivals out. Counter: memory is a notoriously cyclical business — when it turns, prices collapse |
| Broadcom AVGO | Custom silicon for major customers + networking | Medium | Strong | Evidence: builds long-cycle custom chips for large customers, producing durable revenue (though not a contractually locked annuity). Counter: dependent on a handful of hyperscale customers, so concentration risk is high |
| GE Vernova GEV | Gas turbines + grid equipment | Low | Strong | Evidence: sits on the slowest clock of all, power, with a full order book. Counter: AI is only part of its power demand — an indirect beneficiary |
| Eaton ETN | Switchgear + substation equipment | Low | Medium | Evidence: the gateway through which power reaches the rack, with long lead times. Counter: the business spans industrials and autos, so AI is a limited share |
| Vertiv VRT | Data hall power + cooling | Medium | Medium | Evidence: purpose-built for data centres, serving both power and thermal, with a second revenue bite from aftermarket. Counter: the valuation already embeds very high growth |
| Super Micro SMCI | AI server assembly | High | Weak | Evidence: high AI purity, moving in lockstep with NVIDIA. Counter: assembly gross margin is thin to single digits — the textbook case of big revenue, thin profit |
| Ajinomoto Ajinomoto | ABF film for packaging substrates | Low | Strong | Evidence: the critical film layer in high-end packaging substrates; the company reports over 90% share, an extremely hard single point to replace. Counter: fundamentally a cyclical-cum-defensive asset, not an AI growth story |
| Coherent COHR | Optical modules | Medium | Medium | Evidence: the larger the cluster, the more of them get used. Counter: commodity-cyclical with many competitors — the link most prone to overcapacity |
| Astera Labs ALAB | High-speed chip-to-chip interconnect (PCIe/CXL) | High | Medium | Evidence: high AI purity and high gross margin, sitting on a new narrow point in intra-rack interconnect. Counter: could be absorbed into larger silicon, and expectations are already elevated |
| Palantir PLTR | AI operations and data software | Medium | Medium | Evidence: recurring subscriptions and high software gross margin. Counter: not a physical chokepoint where the campus stops without it, and valuation expectations are extremely high |
| CoreWeave CRWV | Neocloud AI capacity | High | Weak | Evidence: extremely high AI purity. Counter: asset-heavy, highly levered, circular financing, and reliant on a handful of large customers |
Read that table across once and you have the essence of the whole report:
- High chokepoint, low AI purity: GEV and ETN — enormously important, but AI is only part of the business.
- High AI purity, weak bargaining power: SMCI and CRWV — breathing in time with AI, yet unable to earn the profit a chokepoint should command.
- Strong moat, expensive expectations: NVDA and ASML — the chokepoint is real, but the price already carries very high hopes.
- Deepest moat, yet cyclical-cum-defensive: Ajinomoto and Shin-Etsu — the highest walls on the chain, but not high growth, and they need a different framework.
- Temporary scarcity, supply at risk: memory and optical modules — short today, potentially not short tomorrow.
Understand those five contrasts and you have the eyes for it: important and worth buying are two different things.
(priced in)
(selected opportunities)
(avoid)
(overlooked value)
One last opening to leave you with: the dozen-odd names above are a demonstration sample, nowhere near the full list. Across the whole chain — from rare gases and photoresist at the very top to on-site operations at the very bottom — roughly 897 listed companies are scattered across the 18 layers, alongside a cohort of still-private companies that could IPO at any time (CoolIT in liquid cooling, Ayar Labs and Lightmatter in optical interconnect) sitting on narrow points of their own. The complete supply-chain map, which you can open layer by layer, is in the accompanying appendix: it lays out all 18 layers, 292 components and roughly 900 companies in front of you, to be worked through layer by layer and name by name. Once you have absorbed the logic of this report, go wander that map — and for every company on it you will immediately be able to ask the same set of questions. Which layer does it sit on? How tight is its grip? When does this shortage expire? Is it really doing AI, or just riding the word? And at this price, has the advantage already been fully discounted?
Sources and Methodology
This report aims to attribute a source and a date to every citable figure. Below are the several dozen most important data points in the report, listed by chapter; a companion data workbook maintains the complete line-by-line sourcing and confidence levels. A few notes on methodology. We distinguish throughout between “hard data” (company filings, regulators, national laboratories, official documents) and “analytical judgement” (inferences drawn from that evidence). Where something is a judgement rather than a fact, the text flags it as such with language like “we estimate” or “base case.”
Power and the Grid
- ERCOT large-load interconnection requests of roughly 410 GW, ~87% of it data centres: ERCOT Large Load Update, 2026-04-01.
- ERCOT planning at roughly 49.8%, a uniform 180-day delay assumption, historical average slippage of about 220 days: ERCOT long-term load forecast methodology update, 2025-04-07.
- Median “application to interconnection” time for generation projects of roughly five years: Lawrence Berkeley National Laboratory (LBNL) interconnection queue study, 2025.
- PJM large loads ramping over at least 36 months: PJM 2026 Long-Term Load Forecast, 2026-01-23.
- Large power transformer lead times of 36 months and beyond: U.S. Department of Energy, Large Power Transformer Resilience Report, July 2024.
- Heavy-duty gas turbine capacity sold out through 2028, with under 10 GW able to be freed up in 2029: GE Vernova investor webcast, 2025-12-09.
- Microsoft’s twenty-year agreement with Constellation (Three Mile Island unit restart): Constellation 2025 Sustainability Report.
- Bloom’s partnership with Oracle, 55-day delivery, roadmap to 2.8 GW: Bloom Energy, 2026-04-13.
Chips, Memory and Manufacturing
- CoWoS capacity climbing from roughly 35k wafers per month in 2024 toward 90k–130k per month by end-2026 (range of industry estimates); TSMC advanced packaging at 10%–20% of capex: TrendForce, 2025-12-08; TSMC 4Q25 earnings call transcript.
- HBM3E consuming roughly 3x the silicon of DDR5 per equivalent bit: Micron investor materials, December 2024.
- SK hynix holding roughly 60% of HBM shipments (2Q25, Counterpoint data): SK hynix 2026 market outlook.
- Micron’s full-year 2026 HBM capacity locked up under price-and-volume agreements: Micron, 2025-12-17.
- Ajinomoto reporting a global share of over 90% in ABF film, the de facto industry standard: Ajinomoto FY2023 annual report.
- ASML as the world’s only supplier of production-capable EUV lithography systems: ASML FY2024 annual report (SEC filing).
- GB200 NVL72 fully loaded rack power of roughly 120 kW: NVIDIA official product page.
Networking, Optics and Cooling
- 800G-and-above optical module shipments in 2026 at roughly 2.6x 2025 levels: TrendForce, 2025-12-08.
- Liquid cooling market growing from roughly $3bn in 2025 to roughly $7bn by 2029: Dell'Oro Group, January 2026.
- Eaton’s ROL2300 coolant distribution unit rated at 2.3 MW on an 8°C approach and 1.15 MW on a 4°C approach: Eaton product literature.
Demand, Circular Financing and Depreciation
- Inference cost falling from roughly $20 to $0.07 per million tokens (November 2022 to October 2024, a ~280x decline): Stanford HAI, 2025 AI Index Report.
- CoreWeave 1Q26 capex of $6.8bn, revenue of $2.08bn, D&A of $1.15bn, interest expense of $536m, and GPU-collateralised financing: CoreWeave 1Q results and $8.5bn financing announcement, March 2026.
- Microsoft, Meta and Google extending server depreciation lives (to roughly 6 years / 5.5 years on certain assets / roughly 6 years respectively): company filings.
- Scale of AI infrastructure investment (hundreds of billions annually, trillions cumulatively): McKinsey, 2025-04-28; roughly $38bn of upfront cost for a single 1 GW campus (illustrative model): Epoch AI, 2026-05-14.
The Evidence Ladder
- Eaton Americas electrical data centre orders up roughly 240% year on year: Eaton 1Q results, 2026.
- Super Micro (SMCI) company gross margin of 9.9% in the most recent fiscal quarter: Super Micro investor relations.
- Company counts across the full chain: 18 layers, 292 components, roughly 897 listed companies after de-duplication, from this project’s proprietary supply-chain registry.
Investing involves risk; proceed with caution. This report is provided for educational and research purposes only and does not constitute investment advice, an offer to invest, or a solicitation to buy or sell any security. Any views, analysis or estimates herein are based on public information the author believes to be reliable, but no representation is made as to their completeness, accuracy or timeliness. Investors should assess investment risk independently in light of their own circumstances and consult a qualified financial adviser where appropriate. Past market performance is not indicative of future results.
Appendix: The Complete 18-Layer Supply-Chain Map
What follows is a layer-by-layer, line-by-line breakdown of the AI data centre supply chain across 18 layers and roughly 292 component categories. Each component carries: a plain-language explanation (using everyday analogies to make the technical concept land), representative listed companies (ordered by relevance, with tickers annotated by exchange), and a one-line statement of its economic role.
This is a reference map, not something to read cover to cover. Use the jump navigation below to go straight to the layer you care about; every layer expands and collapses independently. The genuinely scarce chokepoints are worked through in the bottleneck analysis in the main report — this appendix supplies the full, finer-grained inventory.
Layer overview: Layers 1–3 (demand and the people writing the cheques / cloud and colocation financing / development and construction) are the commercial and infrastructure starting point; Layers 4–6 (generation and the grid / distribution and conversion / cooling and water) are the true physical bottleneck band; Layers 7–9 (compute silicon / supporting and board-level components / memory and storage) are the compute core; Layers 10–12 (networking and interconnect / optics and photonics / servers and system integration) are connectivity and final assembly; Layers 13–15 (semiconductor manufacturing / equipment / materials and substrates) are the upstream supply chain; and Layers 16–18 (EDA and design / infrastructure software / cybersecurity and operations) are the software and services tier.
This layer is the headwaters of the entire chain: it is where the money starts flowing. The people sitting here do not build components — they decide how much to spend, and whether the compute they buy is consumed in-house or rented out. Being furthest upstream, nothing in the seventeen layers below moves until this layer moves, which is why the industry calls it the origin of “demand pull.” Its economics are barbelled. The handful of hyperscalers at the very top earn their money from their own core businesses (advertising, e-commerce, software), and what they spend on AI is a vast outlay. For the pharma groups, brokerages and defence primes further down — the buyers who use AI — AI is a tool for cutting cost and lifting productivity, not a revenue line. When you read this layer, you are reading the authenticity and durability of demand, not whether these firms make money from AI themselves.
1.1 Hyperscalers (hyperscale cloud providers)
The small group of technology giants that build and operate giant data centres themselves and then rent that compute on demand to the rest of the world. Their combined annual spending on buildings, equipment and chips — what the industry calls capex, or capital expenditure, meaning the large one-off outlays a company makes for future business — runs into the hundreds of billions of dollars, and constitutes the single largest order book in the entire AI supply chain. Think of them as super-landlords who have leased an entire industrial park and then sublet the sheds: their budgets determine how much work everyone downstream gets.
1.2 Frontier Model Labs (model labs)
Teams dedicated to training the most advanced large AI models. The bigger and more capable the model, the more outlandish the compute required, which makes these labs the most concentrated and most insatiable pocket of compute demand anywhere. Most are not independently listed but have been funded or absorbed by the giants: Microsoft stands behind OpenAI, Amazon has invested in Anthropic, and Google has DeepMind in-house.
1.3 Sovereign AI (state-level compute programmes)
AI compute infrastructure funded by a state or government and kept under national control. Worried about having their compute supply choked off by someone else, governments everywhere are moving to build AI infrastructure of “their own,” and that has spawned a distinct class of government-facing compute orders. It is much like every country wanting to build its own power station rather than buying electricity from the neighbours in perpetuity.
1.4 Enterprise Private AI (enterprise on-prem deployment)
Large enterprises that decline to hand their data to the public cloud and instead build an AI stack inside their own machine rooms. For reasons of data confidentiality, compliance or cost, banks, hospitals and manufacturers are willing to buy and run the servers themselves. “On-prem” simply means “on the customer's own premises.”
1.5 Neocloud Demand (GPU-cloud customers)
The customer base that rents AI compute rather than building machine rooms of its own, taking capacity by the hour or under contract from the “neoclouds” — companies whose business is renting out GPU compute. How active this cohort is provides one of the most direct read-throughs on whether AI demand is running hot or cold.
1.6 Vertical and Scientific Computing Demand (vertical AI / scientific HPC)
Demand from specialist fields using AI and supercomputing to crack problems specific to their industry. HPC stands for high-performance computing — running extremely complex calculations on vast amounts of compute. Pharma groups hunting for new drug molecules with AI, brokerages running AI risk control, defence agencies processing intelligence, factories running AI simulation: all are hard-cash buyers of compute.
1.7 Inference Token Opex (per-query inference spending)
This is not a category of company but a way of spending money that runs through the entire industry. “Inference” means using a trained model to answer a question — every prompt you send an AI triggers one inference — and a “token” is the smallest billable unit in which AI processes text. Every use of AI costs a little money, and the more it is used the more it costs; that spending accrues month after month like a utility bill, and it is the recurring engine underpinning long-run growth in compute demand. Building the factory is the one-off outlay; but once the factory is running, the meter never stops turning, and inference spending is that meter.
1.8 Reserved Capacity and Compute Offtake (multi-year take-or-pay contracts)
Customers signing long-term contracts years in advance to lock in future compute, with an undertaking to pay whether or not they use it — what the industry calls take-or-pay. Compute is scarce enough that large customers, fearful of being shut out later, simply book it up front. It is the equivalent of block-booking an entire tier of the arena before the concert has been announced: whether or not the seats are filled, the money is owed.
1.9 Vendor-Financed Demand (circular, vendor-funded demand)
Chip and equipment suppliers turning round and putting up the money — as equity or as credit — to help customers afford their own products. It can amplify near-term demand, but it also plants a hazard: money circles around inside the supply chain, and demand that looks robust is partly demand the supplier has funded itself. This is one of the more important warning signals for judging how genuine AI demand really is.
This layer holds the people who actually operate AI compute, together with the people putting up the money behind them to get these asset-heavy builds financed. It sits directly beneath the demand layer: once the order has been placed and the budget set above, this layer is responsible for turning compute into rentable, usable capacity. Economically, most of it is a toll booth and an annuity: once a facility and its compute are built, long leases and long contracts generate revenue year after year, and cash flow is stable. The exception is the neoclouds — built with borrowed money on a bet about future demand — which look far more like a highly levered cyclical business and are much less stable.
2.1 Public Cloud IaaS / PaaS (cloud services rented on demand)
Cloud services that rent out compute, storage and networking on demand. IaaS is “infrastructure as a service” (you rent the raw compute and storage and install your own software); PaaS is “platform as a service” (the development platform comes ready-made and you only write the application). IaaS is like renting an unfinished shell of a flat; PaaS is like renting a fully fitted-out office.
2.2 Hyperscaler Self-build (giants building their own facilities)
Compute that hyperscalers do not rent from anyone else but site, build and operate themselves. They are large enough that self-building is the cheaper option, so they account for a great deal of greenfield construction (building from nothing on empty land) and expansion of existing shells.
2.3 Neocloud GPUaaS (new-model clouds renting GPUs)
A new generation of cloud companies whose business is packaging up large blocks of GPUs (AI chips) and renting them out. “GPUaaS” means “GPU as a service.” They lock in revenue with long-term take-or-pay contracts and then borrow against those contracts to expand. They are the compute landlords of the AI era — except the building was put up with borrowed money.
2.4 Crypto-to-AI Conversion (mining sites repurposed for AI compute)
Sites originally built to mine Bitcoin, converted to host AI compute. Mining and AI are both extraordinarily power-hungry, and these operators already hold the scarce commodity — electricity, and land already energised — so they are redirecting existing power resources to serve AI. The most valuable thing on their balance sheet is not the mining rigs; it is the parcel of land that is already connected to the grid and can be powered up at will.
2.5 Wholesale Colocation (whole-building leases)
Leasing an entire data hall — routinely several megawatts of power — to a single large customer on a long-term basis. “Colocation” means placing a customer's equipment inside a professionally run facility, with the operator supplying power, cooling and security. “Wholesale” refers to large contiguous areas on long contracts. It is the equivalent of letting an entire floor to one large corporate on a lease running well over a decade.
2.6 Retail Colocation (rack-by-rack leasing)
Leasing facility space piecemeal — by the rack or by the cage (a fenced-off compartment) — to small and mid-sized customers, with power and cooling provided. Against the whole-hall wholesale model, retail serves many more and much smaller customers: unit pricing is higher but management is far more fragmented.
2.7 Interconnection and Carrier Hotels (network exchange hubs)
The traffic interchanges where networks and clouds converge and connect to one another. A “carrier hotel” is a building in which multiple carriers place equipment in order to interconnect; a “cross-connect” is the single cable that directly joins two of them. Customers pay a premium for the ability to reach every major network and cloud from close range. It works like an airport hub: the more routes it carries the more valuable it becomes, and a new airport finds it very hard to prise the route network away from an established hub.
2.8 Edge and Micro Data Centres (small facilities at the edge)
Small facilities built close to city centres and close to users, so that data processing sits nearer to the end user and latency — the round-trip time for data — falls. Video streaming, gaming and autonomous driving all suffer badly from lag, and moving the facility into your neighbourhood makes responses faster.
2.9 Data Centre REITs (real-estate investment trusts)
Real-estate investment trusts that exist to own and lease data centres. A REIT is a listed vehicle that packages property, distributes rental income as dividends, and trades on the stock market; it is obliged to pay out most of its earnings to shareholders. Buying one makes you a small shareholder in a data-centre landlord, taking a share of the rent each year.
2.10 Data Centre Infrastructure Finance (project finance and debt)
The asset-management giants putting up the hard cash that gets these multi-billion-dollar facilities built. An AI campus routinely costs billions to tens of billions, far more than an operator can fund from its own pocket, so the money comes through project finance (debt raised for one specific project), GPU-backed lending (borrowing against the chips as collateral), and ABS/CMBS (packaging rents or assets into bonds sold to investors). They are the true paymasters behind this construction wave, and what they earn is lending spread and equity returns.
2.11 Land Banking and Powered Shells (permitted land and energised empty buildings)
Sites secured in advance with permits already granted and power already connected, or buildings erected but not yet fitted with equipment. In the AI era the scarcest input is not the chip; it is a parcel of land that can be energised quickly, and whoever holds that land holds hard currency. A “powered shell” is a bare facility with power and water already in place, waiting only for a customer to move equipment in.
2.12 Speed-to-Power and Site Origination (siting for the fastest energisation)
The specific capability of finding and locking up sites that can be energised soonest. As noted earlier, joining the main grid means queuing for three to five years, so whoever can secure behind-the-meter generation (a campus generating and consuming its own power without waiting on the grid), or a favourable position in the interconnection queue, or the existing power feed of a converted industrial building, is the one who gets the customer switched on first. In a world where everybody is short of electricity, speed to power is itself the most valuable skill on offer.
This layer holds the people who turn a plot of land into a building that can actually be switched on: siting, design, construction, mechanical and electrical installation, and commissioning. It sits directly beneath the operating and financing layers — once the decision to build has been taken and the money committed above, this is the layer that breaks ground. Economically, most of it is commoditised and cyclical: largely engineering contracting and the sale of building materials, with modest gross margins that rise and fall with the construction cycle. Its one significant advantage is order visibility — the AI build-out has stretched backlogs several years forward. A handful of niches (critical commissioning, fire certification, patented support-and-hanger systems) carry some genuine position, but taken as a whole this is not a high-pricing-power business.
3.1 Site Selection and Entitlement (finding land and securing permits)
Before ground is broken: selecting the site on the owner's behalf, assessing whether power and fibre are close at hand, running environmental and geotechnical surveys, and working zoning and approvals through to completion. “Entitlement” means assembling every permission needed to make the parcel legally buildable as a data centre. This is the reconnaissance and paperwork stage — and if the permits do not come through, everything downstream is wasted.
3.2 Engineering and MEP Design (mechanical, electrical and plumbing design)
Designing the building, mechanical, electrical, piping and control systems for the whole facility. “MEP” covers the three principal disciplines — mechanical (M, cooling and ventilation), electrical (E, power supply and distribution) and plumbing (P, water and drainage) — and is the drawing-board foundation of whether a facility will run reliably. This is the factory's full set of blueprints: how power is routed, how heat is rejected, how water flows, all settled at this step.
3.3 Structured Cabling Design (integrated cabling design)
Designing how the thousands upon thousands of network cables and fibres inside a facility are routed and organised. “Structured cabling” means planning otherwise chaotic cable runs into a manageable, extensible system to a defined standard — outside plant fibre, backbone runs, in-hall connections, cable tray (the overhead channels that carry cables), and so on. Without this design discipline, the cabling inside a facility becomes an unmaintainable tangle.
3.4 EPC General Contracting (engineering, procurement and construction)
A single firm taking on design, procurement and construction end to end and handing over the keys. “EPC” abbreviates engineering, procurement and construction; “design-build” means the same firm does both design and construction, removing the back-and-forth and building faster. The owner simply hands over the requirements and receives a facility that can be switched on; everything in between belongs to the contractor. In an AI build-out where schedule is everything, being able to build fast is itself the core competitive advantage.
3.5 Site Civil and Shell & Core (earthworks and building structure)
The hard civil work: foundations, site grading, buried utilities, and raising the building's primary structure. A data centre has to carry extremely heavy liquid-cooled racks, so foundations and structure must be substantially stronger than in an ordinary building. This is the factory's skeleton and footings — invisible, and indispensable.
3.6 Mechanical and Electrical Fit-out (on-site M&E installation)
The site work of physically installing, wiring and positioning transformers, switchgear, cooling pipework and control systems. “Fit-out” means getting the equipment on the drawings actually installed in the building and working. “White space” is the data hall area where the racks ultimately sit. Civil work produces an empty building; the M&E fit-out is what brings power, water and cooling into each hall.
3.7 Modular and Prefabricated Skids (factory-built modules)
Assembling complete power and cooling systems in a factory as standard modules or “skids” (equipment sets mounted on a base and shipped as a single unit), then craning and bolting them together on site, eliminating a great deal of field construction. It is Lego logic: rather than laying brick by brick on a building site, build the whole block in the factory, ship it, and clip it into place — faster and more consistent. In a schedule-driven AI build-out, that speed is extraordinarily valuable.
3.8 Containment and Raised Floor (aisle containment and raised access flooring)
The containment systems that separate cold air from hot, and the raised floors that create an underfloor void for cabling and airflow. “Containment” uses panels and doors to keep supply air and exhaust air from mixing, which raises cooling efficiency; a “raised floor” lifts the floor slab so the space beneath can carry cold air and cabling. Containment is effectively a dedicated lane for the cold air, stopping it from being wasted by mixing with the hot.
3.9 Project Management and Commissioning (owner's representation and acceptance testing)
Tracking schedule and controlling cost on the owner's behalf throughout, then testing and accepting every system in successive stages before handover. “Commissioning” runs from the individual device up to the whole campus, level by level (the industry labels them L0 through L6), confirming that power, cooling and backup all hold up under real load before anyone dares hand over. A “load bank” is the equipment used to simulate full-load heat output and prove that power and cooling can take it. This is the factory's full medical examination before start-up — and no keys change hands until it passes.
3.10 Fire and Life Safety Systems (fire protection and life safety)
Fire detection, suppression and life-safety systems for the data hall. A facility is full of chips worth hundreds of thousands of dollars apiece, and conventional water sprinklers would destroy the equipment, so operators use “clean-agent suppression” (discharging an inert gas that extinguishes without harming equipment) or “pre-action sprinklers” (pipes normally kept dry, charged with water only once a fire is confirmed). “VESDA” very-early-smoke detection raises the alarm before visible smoke appears. This is the factory's fire brigade and security detail at once: it must put the fire out without destroying the very expensive equipment in the process.
3.11 Structural Steel and Pre-engineered Buildings (steel frames and prefabricated structures)
The steel beams and frames that hold the building up, and factory-prefabricated metal buildings. Liquid-cooled racks are extremely heavy, so floor slabs and steelwork need purpose-designed load reinforcement. A “pre-engineered building” is one whose steel members are manufactured to standard in a factory and shipped for rapid on-site assembly. This is the factory's steel skeleton, built to carry racks far heavier than an ordinary building would ever see.
3.12 Roofing, Envelope and Waterproofing (roof, facade and damp-proofing)
Delivering a roof, facade and waterproofing layer that do not leak. A data hall is filled with electronics that cannot tolerate water, and any ingress through roof or wall is a major incident, so the envelope and its waterproofing must be absolutely watertight. The “envelope” is the building's outer shell — roof plus walls. This is the factory's raincoat, keeping the priceless equipment inside entirely separated from the weather outside.
3.13 Seismic Bracing and Restraint (earthquake reinforcement)
Securing heavy equipment, racks and pipework to seismic code so that nothing sways or topples in an earthquake. The kit inside a data hall is both heavy and expensive, and in seismic zones it requires purpose-made bracing, restraints and vibration isolators. This is a seat belt for very expensive equipment: when the ground moves, the kit does not tip over and destroy itself.
This layer governs the source of the electricity itself: from large regulated utilities, to campuses burning natural gas to generate on site, to nuclear, fuel cells, wind, solar and storage, and on to the transmission networks and large substations that haul power across long distances at hundreds of thousands of volts. It sits at the energy end, furthest upstream in the whole chain, and hands off downstream to Layer 5 (getting power into the building).
Economic character. Two quite different businesses are mixed together here. One is the annuity utility (regulated, steady returns, rent-like, never cheaply valued and never explosive). The other is cyclical equipment manufacturing (gas turbines, transformers, transmission gear, where the order book follows the capex wave and where sold-out capacity is currently conferring a spell of seller's pricing power). Before buying into this layer, be clear about which of the two you are actually buying: the annuity, or the cyclical upswing.
4.1 Regulated Utility Generation
The familiar electric utility: it generates power and sells it to customers over a government-regulated grid. Tariffs and allowed returns are set by the regulator, so revenue is as steady as an annuity on a long-term power contract — and equally incapable of growing quickly. It is a landlord collecting rent under government-controlled leases: assured in fair weather and foul, but never the route to an overnight fortune.
4.2 Independent and Merchant Generation (IPP / merchant generation)
IPP stands for Independent Power Producer. These generators are not subject to retail tariff regulation and sell their output at market prices or under long-term agreements directly to large customers — AI data centres among them. The essential difference from a regulated utility is that the price floats with the market, which is why this is also called merchant generation. If the regulated utility is the landlord with a controlled rent, this is the landlord quoting at whatever the market will bear — and earning considerably more when conditions are good.
4.3 Gas Turbines and Reciprocating Gensets
A gas turbine is the large machine that burns natural gas on site and drives blades with the resulting hot gas stream to generate electricity; reciprocating gensets (pistons moving back and forth, on the same principle as a car engine) suit more flexible small- and mid-scale duty and standby generation. This is the most realistic near-term answer to the large-power shortfall. Sub-types include: heavy-duty frame gas turbines — the largest and most efficient, used for baseload plant; industrial mid-range gas turbines — moderate output with better flexibility; aeroderivative turbines — fast start-stop, suited to peaking; reciprocating gas engine sets — modular and easy to maintain; dual-fuel reciprocating engines — able to switch fuel; CHP / cogeneration sets — higher overall energy efficiency; and mobile / temporary power units — trailer-mounted, for immediate relief.
4.4 Large Light-Water Nuclear Reactors (nuclear LWR)
LWR stands for Light-Water Reactor, the dominant commercial nuclear design in service today (ordinary water serves as both coolant and moderator). This component covers three distinct things: uprating and extending the life of existing ageing units, restarting units that have been shut down, and newbuild large pressurised-water (PWR) or boiling-water (BWR) reactors. The sub-segments include: uprate / life extension — getting more output and more years out of existing plant; restart / repower — bringing shut-down units back to generation, as with Microsoft's Three Mile Island restart and Amazon's purchase of Susquehanna capacity; large newbuild PWR / BWR — building a large nuclear station from scratch; the nuclear turbine island — the large steam-turbine set that converts steam into electricity; NSSS / RPV (nuclear steam supply system and reactor pressure vessel) — the core steel vessel that holds the fuel and raises steam; and nuclear fuel services and LEU (low-enriched uranium) — fuelling the reactor.
4.5 Small Modular Reactors (nuclear SMR)
SMR stands for Small Modular Reactor: nuclear plant built as standardised small modules, factory-produced and assembled on site, in theory cheaper, faster and more flexible. It is the favourite subject of headlines and the sexiest story in the layer — but the overwhelming majority cannot supply power at scale before 2030 and contribute nothing to the shortfall over the next year or two. The technology routes include: light-water SMRs — miniaturisation of mature light-water technology, closest to deployment; liquid-metal fast SMRs (LMFR) — the route taken by Oklo and NANO Nuclear; molten-salt reactors (MSR) — theoretically safer, and further out; high-temperature gas-cooled reactors (HTGR) — gas-cooled designs capable of high outlet temperatures; microreactors (<20 MWe) — units small enough to move by truck; SMR power island modules — the generating module of an SMR; and HALEU fuel services (High-Assay Low-Enriched Uranium) — the specialist fuel many SMR designs require.
4.6 Fuel Cells and Distributed Generation
A fuel cell does not burn anything; it generates electricity by reacting fuel (usually natural gas or hydrogen) directly, which makes it quieter and lower-emitting. “Distributed generation” means generating right on the campus, immediately adjacent to the load (behind-the-meter), without queuing for the main grid. Solid-oxide fuel cells are among the few options across the six generation routes that can be installed and generating now at scale (reciprocating gas sets and small gas turbines can also be deployed reasonably quickly on suitable sites). The sub-types: solid oxide fuel cells (SOFC) — Bloom Energy's core product, able to run directly on natural gas and installable today; proton exchange membrane fuel cells (PEM) — fast start-stop, used more often for backup; molten carbonate fuel cells (MCFC) — high-temperature, suited to cogeneration; hydrogen backup power — emergency reserve power on hydrogen; power conditioning — converting the fuel cell's DC output into usable AC; and reformer / desulfurisation skids — pre-treating natural gas into fuel clean enough for the cell.
4.7 Renewables: Solar, Wind and Geothermal
The collective term for clean generation. Solar PV and wind are cheap but intermittent, dependent on the weather; geothermal (generating from subsurface heat) is steady but geographically constrained. The new generation of “enhanced geothermal systems” (EGS, drilling to create an artificial heat reservoir) aims to break that geographic constraint. Sub-segments: central and string inverters — the core equipment converting panel DC output into AC; rooftop and carport PV — panels on a campus's own roofs and car parks; utility-scale solar — large ground-mounted solar farms; onshore and offshore wind — large turbines on land and at sea; and EGS and conventional binary geothermal — generation from subsurface heat.
4.8 Grid-Scale Storage and Long-Duration Storage (grid-scale BESS / LDES)
BESS stands for Battery Energy Storage System: storing power in large batteries and releasing it when needed, shaving peaks and filling troughs for intermittent sources like wind and solar. LDES stands for Long-Duration Energy Storage, capable of discharging continuously for far longer (hours to days) and addressing the problem of successive cloudy, windless days. It is the grid's power bank: charging when solar output is abundant during the day, discharging at night when it is not. Technology types: LFP container batteries and NMC container batteries — mainstream lithium storage; sodium-ion grid batteries — sodium in place of lithium, better on cost and resource availability; pumped hydro — the original large-scale long-duration store; gravity / mechanical, compressed air and thermal LDES — the various long-duration approaches; vanadium flow, iron-zinc and iron-air batteries — suited to very long discharge; and battery management systems (BMS) and container integration — monitoring and systems integration.
4.9 High-Voltage Transmission and HVDC
The high-voltage network that hauls power over long distances from remote generation to the campus. HVDC stands for High-Voltage Direct Current, which loses less over long distances and subsea crossings than conventional AC — at the price of expensive converter stations at each end to shuttle between DC and AC. AC is the ordinary road; DC is the motorway, and on long journeys the motorway saves more. Sub-segments: HVDC converter stations, LCC and VSC types — the core stations at each end that convert between DC and AC; HVDC converter transformers and valve stacks — the critical heavy plant inside those stations; HV overhead lines and underground HV cable systems — the circuits that actually carry the power; protection relaying — millisecond-scale isolation on fault; and transmission FACTS/STATCOM and series compensation — equipment that holds grid voltage steady and raises transfer capability.
4.10 Utility Substations and Switchyards
A substation is the grid's hub for stepping voltage up and down and for aggregating and distributing power; a switchyard is the open-air area within it filled with switches and busbars. This is where transmission-level extra-high voltage is stepped down and sent onward, with fault isolation, protection and metering handled along the way. It is also the slowest-delivering and most chokepointed stretch of the entire layer. Sub-segments: EHV power transformers and generator step-up units (GSU) — ordering now means waiting 36 months or more, the single tightest link in the chain; gas-insulated switchgear (GIS) and air-insulated switchyards (AIS); HV circuit breakers and disconnect / earthing switches; instrument transformers (CT / VT) — scaling large currents and voltages down to something an instrument can read; revenue metering and synchrophasors — precise energy measurement and grid phase monitoring; and substation RTU/SCADA hardware and protection & control panels.
4.11 Interconnection Queues and Grid Services
Before a large campus can draw power it must apply to the utility for interconnection, then queue while a grid impact study is run (assessing whether a load of that size will overwhelm the local network) — that is the interconnection queue. “Grid services” covers things like demand response (voluntarily shedding load at peak in exchange for compensation) that help keep the network stable. This is the step money cannot accelerate: physical construction plus regulatory approval means a median wait of roughly five years.
4.12 Power Purchase Agreements, Tariffs and Gas Supply (PPAs / tariffs / gas supply)
A PPA is a Power Purchase Agreement, the long-term contract under which a data centre buys power from a generator (usually locking in both price and volume — a commercial contract, not a piece of equipment). “Gas supply” covers the entire upstream that fuels an on-site gas plant: extraction, pipelines, storage and transport. This link is fundamentally commercial and contractual, and it determines from whom, at what price, and in what quantity the power is bought.
4.13 Gas Turbine Balance of Plant
A gas-fired plant is a great deal more than the turbine itself: “balance of plant” (BOP) is the full set of ancillary equipment outside the turbine that makes the station run. This is the supporting beneficiary set that most people overlook. Sub-segments: heat recovery steam generators (HRSG) — recapturing waste heat and lifting efficiency substantially; bottoming steam turbines and air-cooled condensers — condensing steam with air where water is scarce; feedwater pump skids and lube-oil skids; inlet air filtration and chilling — cleaning and cooling turbine intake air to raise output; demineralised water treatment — producing the pure water the boiler requires; and exhaust stacks and SCR (Selective Catalytic Reduction) — cutting NOx emissions.
4.14 Fuel Handling and Gas Infrastructure
The complete set of facilities that fuel on-site generation and store that fuel safely: gas pressure regulation and metering, compression and filtration, diesel tankage for backup, and eventually hydrogen and ammonia storage and handling. Without this link, the gas plant and the standby sets have nothing to burn. Sub-segments: onsite gas pipeline laterals — the spur that brings the trunk gas line onto the campus; metering and regulating stations and gas conditioning / filtration skids; gas compression skids and fuel transfer pumping; backup diesel storage tanks; and hydrogen storage and compression and ammonia carrier storage — for the clean fuels of the future.
4.16 Utility-Scale BESS PCS and Grid-Forming Inverters
Storage batteries hold direct current while the grid runs on alternating current, and the PCS (Power Conversion System) is the interpreter between them, converting bidirectionally. Grid-forming inverters go a step further: they actively establish voltage and frequency, holding up the framework of the network the way a conventional generator does — which matters more and more as inverter-based renewables take a larger share of the grid. An ordinary inverter dances to the grid's beat; a grid-forming inverter is the drummer setting the beat itself. Sub-segments: MV PCS skids and bidirectional inverter-transformer skids; grid-following and grid-forming inverters; battery plant controllers and storage EMS/SCADA gateway hardware; and black-start and grid-support control — using storage to restore supply first when the network goes dark.
4.17 Microgrid Controllers and Islanding (microgrid controller / BTM EMS / islanding)
When a campus simultaneously holds its own gas engines, fuel cells, storage and a grid connection, something has to conduct them — deciding when to generate, when to store, and when to switch to standalone operation. That is the microgrid controller. “Islanding” is the ability to disconnect from the main grid and run the campus on its own generation; “BTM” means behind-the-meter, on the campus side. It works like an orchestra conductor, keeping several in-house power sources and the grid itself playing in time rather than over one another. Sub-segments: microgrid controllers — coordinating multiple sources; islanding / reconnection controllers — safe transition off the grid and back on; and protection and synchronisation controllers — aligning phase at the instant of reconnection to prevent a shock to the system.
What this layer is, and where it sits. Once power has come through the campus gate from Layer 4, it must pass down a stepped chain of transformation and distribution — from hundreds of thousands of volts all the way to a few volts — before being delivered, cleanly and steadily, to the tens-of-thousands-of-dollars chip inside the rack. This layer is that inside-the-fence distribution chain: transformer → switchgear → uninterruptible power supply → power distribution unit → rack power, plus protection, metering, cabling and power-quality conditioning. It sits between Layer 4 (the grid) and the IT equipment in the data hall.
Economic character. There is a stratification here that almost nobody articulates clearly. At the facility level — transformers, switchgear, complete UPS systems — this is a fat-margin business belonging to five global oligopolists, walled off by certification. But the further you move toward the rack (rack power supplies, power shelves), the more the field is dominated by Taiwanese power-supply ODMs on thin margins competing on cost. So “bullish on electrical equipment” demands a follow-up question: which stretch of the power chain do you mean? Meanwhile, rack-level high-voltage DC (HVDC) is the new business that was a niche only a few years ago and now deserves the closest attention in the layer.
5.1 Medium-Voltage Switchgear (MV switchgear)
Switchgear is the circuit's combined gate valve and fuse assembly: it distributes current and, on fault, isolates within milliseconds to protect everything downstream. Medium-voltage (MV, typically a few thousand to a few tens of thousands of volts) switchgear splits the incoming MV supply out to individual buildings and halls, and a campus holds a great many of them. Sub-segments: air-insulated MV switchgear (AIS, insulated by air, physically large) and SF6-free gas-insulated switchgear (SF6-free GIS, insulated with environmentally benign gas, far more compact); metal-clad switchgear (metal compartments, high safety); MV vacuum circuit breakers (extinguishing the arc in vacuum to break the current); reclosers and sectionalizers (automatic re-close attempts after a fault, isolating the faulted section); protection relay panels (detecting anomalies and commanding the trip); and arc-resistant gear (containing an internal arc flash so it cannot injure personnel).
5.2 MV / LV Transformers
Transformers step voltage up and down. Facility-level transformers take medium voltage down to the low voltage (LV) the data hall can use. They come in two broad families: liquid-filled (cooled by insulating oil) and dry-type (oil-free, better suited to indoor fire safety). This is one of the longest-lead-time links in the whole distribution chain. Sub-segments: liquid-filled distribution transformers (high capacity, mostly outdoors); dry-type cast-resin and VPI transformers (epoxy or vacuum-pressure-impregnated insulation, safe indoors); K-rated harmonic-tolerant transformers (built to absorb the harmonics that a data centre's non-linear loads generate without overheating); isolation transformers (electrical isolation and interference suppression) and rectifier transformers (matched to rectifier equipment); and transformer monitoring sensors (real-time oil temperature, loading and health).
5.3 Unit Substations
Transformers, switchgear and associated components pre-assembled into a modular miniature substation, built complete in a factory and shipped to site, removing the time cost of installing each piece in the field — which is extraordinarily valuable to a schedule-driven AI campus. They are prefabricated substation Lego bricks: deliver, connect, energise. Sub-segments: prefabricated unit substations and skid-mounted power centres (complete power modules on a skid); e-house power modules (an entire prefabricated electrical room); and containerised substation pods (shipped in a standard container).
5.4 Facility Backup Gensets
The on-site generator sets that pick up the load the instant the grid fails (a “genset” being a generator set). Unlike the primary generation of Layer 4, these are purely emergency reserve: idle in normal operation, starting the moment the supply drops to hold up critical load. Sub-segments: standby diesel and standby gas gensets (the two mainstream emergency sources); HVO- and biodiesel-ready sets (running on cleaner renewable diesel); radiator cooling packages and emissions aftertreatment (bringing emissions within limits); and day-tank fuel systems (fuel stored close by so the set can always start).
5.5 Paralleling and Transfer Switching (paralleling / ATS / STS)
A campus with both a utility feed and several backup sets needs equipment to switch between sources and to parallel multiple sets. An ATS is an Automatic Transfer Switch (switching automatically from utility to generator on an outage); an STS is a Static Transfer Switch (using power electronics for seamless millisecond transfer, for sensitive loads); and paralleling switchgear coordinates multiple generators into a single virtual power station. Sub-segments: ATS and STS; generator paralleling switchgear (synchronised parallel operation of multiple sets); closed-transition transfer switches (briefly paralleling both sources so the load never drops) and bypass-isolation switches (allowing maintenance without an outage); and load-bank connection switchgear (connecting a dummy load to test the generators).
5.6 UPS Systems
UPS stands for Uninterruptible Power Supply, the battery-backed system that takes over the instant utility power fails. A chip cannot lose power for even a second — every running job would be lost and hardware may be damaged — and the UPS holds the supply through the few tens of seconds between the utility dropping and the backup generators coming up to speed. It is the airbag of the electrical system: inconspicuous in normal operation, and life-saving in a single critical moment. Sub-segments: online double-conversion UPS (power is converted to DC and back to AC, isolating the load from every grid disturbance — the cleanest output) is the data-centre mainstream; line-interactive UPS (for smaller applications) and delta-conversion UPS (a higher-efficiency architecture); transformerless modular UPS (dispensing with the heavy transformer and scalable on demand); diesel rotary UPS (DRUPS, using a flywheel plus diesel engine in place of batteries); lithium-ready UPS modules (moving from traditional lead-acid to lithium to save floor space); and UPS bypass switchgear (feeding the load around the unit during maintenance).
5.7 UPS Batteries, Lead-Acid and Lithium (VRLA / Li)
The cells that actually hold the charge inside a UPS. The traditional choice is VRLA (Valve-Regulated Lead-Acid: cheap and durable, but bulky and heavy), increasingly displaced by lithium (higher energy density, smaller footprint, longer life). Sub-segments: VRLA lead-acid (established and low-cost); LFP UPS batteries (safer) and NMC UPS batteries (higher energy density), the two lithium routes; sodium-ion UPS batteries (a newer route with friendlier resource economics) and nickel-zinc thin-plate cells; and UPS battery management systems (BMS, monitoring the safety of every cell) and battery cabinets and racks (support and cabling).
5.8 Flywheels and Facility-Level Storage UPS (flywheel / facility BESS)
Batteries are not the only way to hold instantaneous reserve. A flywheel UPS stores kinetic energy in a heavy wheel spinning at high speed and converts that rotational inertia back into electricity for seconds to tens of seconds when the supply drops (no chemical cells, long life, small footprint); supercapacitors can charge and discharge at very high power over very short intervals, riding through momentary voltage sags. The flywheel is a fast-spinning top: at the moment of failure, its momentum is turned back into electricity. Sub-segments: kinetic flywheel UPS and short-duration facility BESS; supercapacitor ride-through banks (absorbing momentary voltage sags); and UPS-BESS hybrid cabinets (combining UPS and storage in one enclosure).
5.9 LV Switchgear and Busway
Once power has been stepped down to low voltage, LV switchgear and busway (a metal conductor bar carrying high current — effectively a tappable power motorway) carry the distribution onward to each hall and each row of racks. Busway is easier to tap and more flexible to expand than cable. Sub-segments: LV switchgear and switchboards, and panelboards; facility busway / bus duct (the high-current trunk) and tap-off boxes (drawing power at any point along the run); air circuit breakers (ACB, high-current main breakers) and moulded-case circuit breakers (MCCB, protecting smaller circuits); and power bus monitoring modules (real-time busway current and temperature).
5.10 PDUs, Remote Power Panels and Rack Power (PDU / RPP / rack power)
A PDU is a Power Distribution Unit, dividing power out to each row of racks and then to each level within the rack. They come as floor-mount units (room-scale cabinets) and rack PDUs (the power strip inside the rack). An RPP is a Remote Power Panel, an extension distribution panel downstream of a floor-mount PDU. Rack PDUs are further graded by intelligence. Sub-segments: floor-mount PDUs and remote power panels; rack PDUs in basic, metered and switched variants (from supplying power only, to measuring it, to switching each outlet remotely); rack-level ATS (automatic transfer between dual feeds inside the rack) and branch-circuit monitoring PDUs (metering every circuit individually).
5.11 In-Rack Power Shelves and Battery Backup Units (power shelf / BBU)
Modern AI racks package power as “power shelves” slotted into the rack itself, centrally rectifying AC into the DC the servers need (48 V, for example) at higher efficiency and with easier maintenance. A BBU is a Battery Backup Unit, a small battery mounted in the rack that picks up locally the instant power drops, reacting faster than a centralised UPS. This is the stretch dominated by Taiwanese power ODMs, competing on thin margins and cost. Sub-segments: AC-DC power shelves, and 48 V / ORV3 power shelves (ORV3 being the Open Compute Project's Open Rack v3 standard); battery backup units and power-shelf rectifier modules (the core AC-to-DC stage); and power-shelf controllers (coordinating multiple power modules) and rack power busbar assemblies (the copper bars that distribute power within the rack).
5.12 HVDC Rack Power Conversion
This is the stretch of Layer 5 undergoing the most violent change, and the one most worth watching. HVDC stands for High-Voltage Direct Current. Because a 120 kW rack fed at traditional low voltage (12 V) loses far too much to copper resistance — the busbars would be too thick to physically fit — the power architecture is being forced to migrate from 12 V to 48 V to ±400 V and even 800 V DC. That has turned “rack power” into a new business that was a niche only a few years ago, and it has pulled power semiconductors into the story alongside it (high-voltage conversion calls for wide-bandgap, high-efficiency power devices such as gallium nitride and silicon carbide). Sub-segments: MVAC-to-LVDC power nodes (converting medium-voltage AC directly to low-voltage DC in a single step); rack HVDC rectifier systems and solid-state transformer (SST) power nodes (power electronics in place of the conventional iron-core transformer, far smaller and more flexible); HVDC-to-48 V DC-DC shelves (stepping the high-voltage DC back down to 48 V); and HVDC power sidecars (a standalone power unit hung alongside the rack) and DC distribution controllers.
5.13 Surge Protection, Grounding and Power Monitoring (SPD / grounding / power monitoring)
This stretch handles protection, earthing and metering. An SPD is a Surge Protective Device (blocking the transient voltage spikes produced by lightning or switching, protecting equipment downstream); grounding carries fault current safely to earth, protecting both people and equipment; and power monitoring meters each circuit and watches power quality. EPMS refers to the field hardware of the Electrical Power Monitoring System. Sub-segments: SPDs and grounding / bonding systems (safely discharging fault current); branch-circuit power meters (per-circuit metering) and power quality meters (monitoring harmonics and voltage variation); and insulation monitoring devices (detecting degrading insulation and leakage) and EPMS gateway / RTU hardware (the field acquisition layer of the monitoring system).
5.14 Facility Power Cables and Accessories
The bloodstream connecting everything above: MV and LV power cable, together with the terminations, tray and lugs that go with it. It looks unremarkable, but an AI campus consumes an enormous quantity of copper and holds cable to demanding fire and service-life requirements. Sub-segments: MV and LV power cable; termination and splice kits (insulating and sealing the joints) and cable lugs and connectors; cable tray, ladder and raceway (supporting and protecting bundled cable); and flexible power whips (the flexible final drop at the rack) and fire-rated cable systems (maintaining critical supply through a fire).
5.15 Power Quality and Reactive Compensation
The many power supplies and variable-frequency drives in a data centre generate “harmonics” (distortion of the current waveform, which heats equipment and erodes efficiency) and “reactive power” (the component that does no useful work yet occupies network capacity). This stretch is the equipment that treats those power-quality problems: filters strip out harmonics, while capacitors and STATCOMs compensate reactive power and hold voltage steady. It is noise cancellation and voltage regulation fitted to a noisy circuit. Sub-segments: active harmonic filters (actively cancelling harmonics) and passive harmonic filters (fixed components doing the filtering); power factor capacitor banks (compensating reactive power and lifting power factor) and reactor banks (current limiting and filtering); facility-scale STATCOMs (static synchronous compensators for fast voltage support) and static var compensators (SVC); and power factor correction controllers.
5.16 HVDC DC Protection Gear
As racks move to high-voltage DC, a complete set of equipment is needed to protect DC systems specifically. DC differs fundamentally from AC: alternating current crosses zero a hundred times a second, so the arc is easy to extinguish and the current easy to break, whereas direct current never crosses zero and the arc is extremely hard to quench. That makes DC breakers and DC fuses both harder to build and more critical. Solid-state DC breakers (interrupting instantaneously with power semiconductors) are the new frontier. Sub-segments: DC circuit breakers, solid-state DC breakers (semiconductor-speed interruption) and hybrid DC breakers (mechanical and solid-state combined); DC fuse switches and DC contactors / disconnects (making, breaking and isolating DC); DC busbar switchgear and precharge / discharge units (buffering inrush at energisation); and HV DC connectors (interconnects purpose-built for high-voltage DC).
Deliver the power to the chip, switch the chip on, and it throws off a startling quantity of heat. A fully loaded NVIDIA GB200 NVL72 rack draws roughly 120 kilowatts, essentially all of which ends up as heat — far beyond anything conventional air conditioning can hold down. This layer is the complete set of equipment and loops that moves that heat away from the chip, out of the data hall, and ultimately off the campus altogether. It is the twin bottleneck bolted to power supply: if you can get the electricity in but cannot get the heat out, the machines still will not run.
The economics here are genuinely interesting, because this is not one business but three stacked on top of each other. At the top sit complete cooling systems and liquid-cooling loops — a fat-margin, oligopoly toll-booth business (a toll, like a road charge: anyone who wants to pass has to pay). In the middle are the parts pressed against the chip — cold plates, fans — mostly Taiwanese contract manufacturing on thin margins competing on cost. At the bottom are the coolants and the water, an invisible annuity business (an annuity, like a pension, arriving automatically year after year): hardware sells once, but coolant has to be tested and topped up on a schedule and water has to be treated every single day, and that revenue is collected year after year by a set of chemical and water-utility companies that never touch a cold plate. So “bullish on cooling” is a statement without content until you answer the prior question: which stretch of cooling do you mean?
What follows works up the upgrade path from air to liquid, part by part.
6.1 Room-Level Air Conditioning (Air CRAC / CRAH, precision data-hall cooling)
This is the most traditional approach to cooling: large industrial air conditioning installed for the data hall. A CRAC (Computer Room Air Conditioner) carries its own compressor and refrigerant circuit, working on the same principle as the unit in your home, moving heat with refrigerant. A CRAH (Computer Room Air Handler) does not generate cooling itself; it uses chilled water piped in from elsewhere (chilled water — water cooled down by a chiller plant) to cool the air. Put simply: a CRAC is an air conditioner with its own built-in refrigerator, a CRAH is a fan unit that only moves air, with the cold source somewhere else. Sub-segments include dry (direct-expansion refrigerant) units, glycol-based units (antifreeze as the intermediate medium), fan-wall air handlers (an entire wall of fans), underfloor supply units, and humidification / dehumidification modules. In the AI era, pure air cooling can no longer hold down high-power racks and is being displaced by liquid cooling — but it remains heavily deployed in low- and mid-density halls and throughout the transition.
6.2 In-row Cooling & Containment
As a row of racks runs hotter and hotter, cooling the whole hall makes less sense than dropping the air conditioning directly between the racks (in-row) and cooling at close range, which is far more efficient. Containment means using doors, roof panels and blanking to physically separate cold air from hot air so the two do not mix randomly across the hall. Consider: if the cold air blown out at the front of a rack and the hot air exhausted at the back churn together in the room, you are effectively running the heating and the air conditioning at the same time, for nothing. Containment builds a wall around each aisle, so the cold stays cold and the hot stays hot. Sub-segments include in-row coolers (DX and chilled-water), hot-aisle containment, cold-aisle containment, rack air dams and blanking panels (plugging the empty rack positions so cold air cannot leak through), and containment door-and-ceiling systems.
6.3 Economizers & Evaporative Cooling (free cooling and evaporative cooling)
This is the family of free-cooling tricks, built on one idea: when it is cold outside, why spend electricity making cold? Just bring in the outdoor cold air or cold water. An economizer is the apparatus that admits that outdoor cold source, either air-side (drawing outdoor air in directly) or water-side (using cold outdoor water). Evaporative cooling exploits the physics of water absorbing heat as it evaporates — the same reason hosing down a patio in summer makes it feel cooler. Sub-segments include air-side economizers, water-side economizers, indirect evaporative coolers, direct evaporative coolers, adiabatic assist coolers (misting to add humidity and boost cooling), and free-cooling heat exchangers. This stretch bears directly on a data centre's electricity bill and water draw, and is the key lever on both.
6.4 Direct-to-chip Liquid Cooling (cold-plate liquid cooling)
This is the main battleground of AI cooling. A cold plate is a metal plate with fluid channels running through it, pressed directly onto the top of a hot chip — a GPU or CPU — so coolant flowing through the plate carries the heat away at source, far more efficiently than blowing air across an intervening gap. Consider: cooling a chip with air is like fanning a bowl of hot soup; a cold plate is setting the bowl itself into a basin of cold water. Much faster. It divides into single-phase (the fluid stays liquid throughout, carrying heat by flow) and two-phase (the fluid boils and vaporises inside the plate, absorbing far more heat but much harder to control). Sub-segments include single-phase cold plates, two-phase cold plates, GPU/CPU cold-plate assemblies, memory and power-module cold plates (even the memory and power components beside the chip now need their own plates), cold-plate manifold assemblies, and server liquid-cooling kits. This stretch is the physical precondition for an AI rack running at all.
6.5 Immersion Cooling (single-phase / two-phase immersion)
A more radical approach than the cold plate: submerge the entire server board in a tank of non-conductive fluid (a dielectric fluid — insulating, so it will not short a circuit board on contact) and let the liquid wrap around every heat-generating component. Put simply: a cold plate lays a cold towel on the chip; immersion gives the whole machine a cold bath. It splits into single-phase immersion (the fluid does not boil) and two-phase immersion (the fluid boils at the chip surface, condenses against a cold surface at the top and falls back, circulating on its own). Sub-segments include single-phase tanks, two-phase tanks, immersion blade-chassis kits, immersion condenser coils, immersion pump-and-filter skids, immersion lifting and service systems, and the dielectric coolant itself. Immersion remains relatively early-stage; the hard parts are servicing, sealing and the cost of the fluid.
6.6 Rear-door Heat Exchangers (rear-door HX)
An intelligent compromise: build a heat exchanger (a device that transfers heat from one medium to another) full of water channels and hang it on the rack as the rear door. Hot air exhausting from the back of the rack passes first through that grid of chilled-water tubes, the heat is captured on the spot, and the data hall barely feels the exhaust. Consider it a water curtain fitted over the rack's exhaust: the hot air is doused the moment it emerges. Variants include passive doors (no fan, relying on the rack's own fans to push the airflow), active fan-assisted doors (with integral fans for extra capacity), chilled-water doors, and rack-integrated designs. The advantage is that nothing inside the server has to change, which makes it the smooth bridge from air cooling to liquid.
6.7 Coolant Distribution Units (CDU)
The CDU is the heart and central exchange of the entire liquid-cooling loop. Its job is to take coolant from the data centre's primary loop, pass it through an internal heat exchanger, and hand that cooling capacity over to the secondary loop that feeds the cold plates inside the rack — while pumping, regulating temperature, filtering, and monitoring flow. Consider the district heat-exchange substation: the city's main network does not run into your apartment; it reaches a substation first, which then distributes the heat (here, the cooling) to each building. A CDU's rated capacity depends heavily on operating conditions: one Eaton CDU is rated at 2.3 megawatts of cooling at an 8°C delta-T, but only 1.15 megawatts at 4°C. Nameplate numbers mean nothing once you leave the conditions they were validated under, which is why the binding constraint in this link is certified capacity. Variants include liquid-to-liquid (L2L, rejecting heat to facility water), liquid-to-air (L2A, rejecting heat directly to air), in-row, in-rack and facility-scale units, plus pump-control and filtration assemblies.
6.8 Manifolds, Quick Disconnects & Hoses (distribution piping and quick couplings)
The vessels and fittings of the liquid-cooling loop. A manifold is a header with many branch ports, distributing coolant evenly to a row of racks or to every level within one rack — the same idea as the header in a bathroom that splits one supply into several shower heads. The quick disconnect (QD; UQD is the industry-common version) is the least conspicuous and most consequential part in the loop: it seals automatically on connection and does not leak on disconnection, and blind-mate versions (no alignment needed — push it in and it engages) connect without the operator even having to look. Consider a petrol nozzle that seals as it goes in and does not drip as it comes out. A high-density rack holds dozens of them or more, and a single leak can take an entire rack offline — or destroy several million dollars of silicon inside it. This stretch also covers rack secondary-loop manifolds, row-level distribution manifolds, drip-protected blind-mate couplings, quick disconnects, flexible coolant hose, stainless-steel and polymer coolant piping, and balancing valve assemblies.
6.9 Chillers
The chiller is the data centre's high-capacity refrigeration plant, dedicated to driving water down to a low temperature (producing chilled water) and sending it on to the CRAHs, rear-door exchangers and CDUs described above. It is, in essence, an oversized refrigeration machine. Variants include air-cooled units (rejecting heat to outdoor air, roof-mounted), water-cooled centrifugal units (rejecting heat via cooling towers, the most efficient, suited to large campuses), magnetic-bearing oil-free units (the compressor shaft levitates on a magnetic field with no lubricating oil — more efficient and more reliable), screw chillers, absorption chillers (driven by waste heat rather than electricity), modular units, and units with integrated free cooling. These are among the highest-priced and heaviest items in the whole facility-level cooling plant.
6.10 Cooling Towers & Dry Coolers
The last stop on the whole cooling chain: all the heat moved out by every stage upstream is finally rejected to the atmosphere here. A cooling tower carries heat away through water evaporation (and therefore consumes water); a dry cooler relies purely on air blown across metal fins (no water consumption, but lower efficiency). Consider the difference between cooling by sweating — effective, but you lose water — and cooling by fanning yourself: no fluid lost, weaker effect. Variants include open-circuit cooling towers, closed-circuit fluid coolers, dry air coolers, adiabatic hybrid coolers (dry most of the time, spraying water when conditions turn hot, balancing water draw against efficiency), condensate pump skids, and heat-rejection fan arrays. In water-stressed regions, choosing between a tower and a dry cooler is a decision about water rights.
6.11 Coolants, Dielectric Fluids & Refrigerants (working fluids)
The actual bloodstream circulating through the cooling loop. Several categories: water-glycol (the common antifreeze coolant), inhibited water (dosed to stop the piping corroding), single-phase dielectric fluids (non-conductive, for liquid cooling in direct contact with circuitry), two-phase fluorocarbons (specialty fluids that boil and vaporise — but many contain PFAS “forever chemicals” and are being squeezed by environmental policy), low-GWP refrigerants (low global-warming-potential alternatives), and an array of additives and testing services. As noted above, this is an annuity business: the hardware sells once, but coolant has to be tested, topped up and replaced on a schedule, and that money is collected year after year by chemical companies that never touch a cold plate.
6.12 Water Treatment, Reuse & WUE
Data centres are heavy water users, and this stretch is about managing that water, using less of it, and recirculating it. Makeup water treatment purifies incoming raw water to usable standards; blowdown recovery recaptures part of the water that a cooling tower would otherwise discharge once impurities have concentrated; reverse osmosis and deionisation (RO/DI) take water to extreme purity; and alongside these sit side-stream filtration, leak detection, greywater reuse (treating waste water for non-potable duty), and water-quality monitoring. WUE (Water Usage Effectiveness) measures how much water a data centre consumes per unit of electricity used. Consider: in a water-stressed region, how well a site handles water determines outright whether the campus gets permitted and whether it can keep operating.
6.13 Cooling Controls & BMS (building management)
This is the brain and nervous system of the cooling plant. The BMS (Building Management System) is the central controller governing a building's power, water and cooling; the hardware covered here includes cooling PLC controllers (PLC, programmable logic controller — the small industrial control computer on the plant floor), chiller-plant controllers, pump variable-frequency control panels (VFDs letting pumps modulate speed on demand and save power), thermal ride-through controllers (the life-saving function that maintains cooling through the seconds-to-minutes of a power interruption so the chips do not spike instantly), and control gateway / IO panels. Consider: once cooling stops on a 120-kilowatt rack, temperature can climb into the danger band within tens of seconds, which makes this system's ride-through capability the real safety floor. Note: this covers the control hardware; the pure software layer belongs to Layer 17.
6.14 Facility Sensors & Instrumentation
The sense organs of the cooling system: probes distributed throughout the hall, continuously measuring temperature, humidity, differential pressure, coolant flow, energy consumption, leaks and vibration, then passing the readings to the control system through IO gateways (the interface boxes that aggregate and upload field signals). Specifically: temperature probes, humidity probes, differential-pressure sensors, coolant flow meters, BTU energy meters (the heat meter that quantifies exactly how much heat was removed), leak-detection cable (laid under the floor, alarming and locating the moment a leak occurs), and vibration sensors. Consider leak-detection cable as an alarm rope running the length of the pipework: any seepage is identified immediately, down to the metre. For a rack worth several million dollars, that one second of warning is the difference.
6.17 Coolant Filtration & Fluid Conditioning (coolant purification and maintenance)
Coolant in a liquid loop gets dirty over time, drops out contaminants, and entrains air. This stretch is the purification and maintenance that keeps the fluid clean, in specification and free of blockage. Specifically: side-stream particulate filters (diverting a small flow off the main loop, filtering it and returning it, without disturbing primary flow), magnetic filter separators (capturing metallic debris), ion-exchange resin cartridges (stripping ions to hold high purity, preventing corrosion and conductivity), vacuum degassers (pulling out dissolved air, since bubbles degrade both heat transfer and pump performance), chemical dosing skids, dielectric-fluid reclamation units, and inline water-quality analysers. Consider it the equivalent of changing a car's oil and filters on schedule: skip it, and the loop will fail eventually.
6.18 Heat Reuse & Energy Recovery
Rather than throwing away the waste heat a data centre rejects, sell it or use it again. This stretch is the machinery for turning that waste into value: heat-recovery exchangers (extracting the waste heat), district heating interface skids (feeding waste heat into a municipal heating network — many Nordic data centres heat residential blocks this way), heat-pump upgrade systems (pumping low-grade waste heat up to a higher, more useful temperature), thermal storage tanks, organic Rankine cycle generation (ORC, recovering a little electricity from the waste-heat temperature differential), and greenhouse heating. Consider: one data centre's waste heat is enough to warm tens of thousands of nearby homes, and in Europe this is shifting from an environmental gesture into a contracted, revenue-generating business.
6.20 Water Sourcing & Wastewater
The far upstream and far downstream of water: where a data centre draws it from, how it discharges what it has used, and the municipal-facing infrastructure that handles both. Specifically: raw-water intake pump stations (drawing from rivers, lakes or wells), municipal supply connections, on-site wastewater pre-treatment (bringing effluent into compliance before it enters the municipal network), reclaimed-water pipelines (cooling with treated water instead of potable supply, easing pressure on the resource), on-site reservoirs and storage tanks, zero liquid discharge systems (ZLD, recovering all wastewater with nothing discharged — the highest environmental bar), and water-rights metering stations. Consider: in a water-short state such as Arizona, whether a developer can secure water rights and afford reclaimed water determines outright whether a multi-billion-dollar campus gets built.
Start with what this layer does. The central work of an AI data centre is performing an astronomical number of multiplications and additions (AI, at bottom, breaks every sentence you write into numbers and then uses vast quantities of arithmetic to guess the next word). The chip built specifically to do that arithmetic is the accelerator. It is the heart of the entire factory, and it is the layer in this chain with the highest unit price, the fattest gross margin, and the most concentrated attention from capital markets. The economics here are extreme: a very small number of companies — NVIDIA above all — capture most of the industry's profit pool, with pricing power that borders on absurd. At the same time, challengers of every description and national programmes everywhere are fighting to force their way in. So this is simultaneously the most secure gold mine and the most fiercely contested battlefield in the stack. What follows breaks the layer down chip type by chip type.
7.1 Merchant GPUs
GPU stands for graphics processing unit — originally the chip that drew video-game frames, until people discovered it was exceptionally good at working through a great many similar small calculations at once, which is precisely what AI requires. “Merchant” means it is sold openly to anyone, unlike chips that large firms design and keep behind their own walls. Put simply: the GPU is the general-purpose money printer of the AI era. Training large models and running AI inference both rest on it today.
7.2 Custom Training ASICs / XPUs
ASIC stands for application-specific integrated circuit — a chip tailored to one particular task. Where a merchant GPU does everything, an ASIC does one thing, but does it faster, at lower power and at lower cost. XPU is the umbrella term for this class of dedicated accelerator. Consider: a GPU is a Swiss Army knife that will cut anything; an ASIC is a purpose-built kitchen knife that cuts one ingredient quickly and cleanly. Large cloud providers have each begun designing these dedicated chips, both to avoid being held hostage by a single supplier in NVIDIA and to save money.
7.3 Inference Accelerators / NPUs
Two terms worth separating first. Training is the months-long process of teaching an AI model; inference is the single burst of computation performed each time that trained model answers your question. NPU stands for neural processing unit, a chip optimised specifically for that inference step. Because a model, once trained, is then used billions upon billions of times, inference is a steady, extremely high-volume business — well worth a dedicated low-power, low-cost chip of its own.
7.4 FPGAs as Accelerators (reconfigurable silicon)
FPGA stands for field-programmable gate array. An ordinary chip's function is frozen the moment it leaves the fab; an FPGA is different — after it ships you can still use software to rewire its internal circuitry into whatever shape you need. Put simply: an ordinary chip is a house already built; an FPGA is a box of Lego you can dismantle and rebuild. It is flexible and quick to change, but expensive per unit of compute relative to dedicated silicon, so in AI it is used mostly where the design has to keep changing.
7.5 Wafer-Scale Engines (one chip from an entire wafer)
An ordinary chip is a small piece cut out of a round silicon wafer. A wafer-scale engine inverts that: do not cut at all, and make the whole wafer into a single enormous chip. Data then never has to leave the die and come back, which makes it extraordinarily fast internally. Consider: the conventional approach slices a large cake into many small pieces to share; the wafer-scale engine brings the whole cake to the table as one course. It is a niche path, but a genuinely distinctive one.
7.6 Dataflow, In-Memory & Photonic Compute (non-traditional accelerator architectures)
Almost every chip built today follows the old von Neumann architecture, in which compute and memory are separate and data has to shuttle back and forth between them — and the shuttling itself burns both power and time. This category covers the attempts to replace that architecture. In-memory computing lets the data be computed where it already sits, with no movement at all. Photonic computing uses light rather than electricity to compute, which is in theory both faster and far more efficient. Most of this remains early-stage and pre-commercial: high on narrative, high on risk.
7.7 Hyperscaler In-House Silicon Programmes
Not a new kind of chip, but a separate lens on the in-house design effort mentioned above. Google's TPU, Amazon's Trainium, Microsoft's Maia and Meta's MTIA are all chips the hyperscale cloud providers built themselves, to save money and to reduce their dependence on NVIDIA. As a rule they are not sold externally; the developers consume them internally.
7.8 Advanced Packaging Content in the Accelerator
A modern AI chip is not one isolated die but several smaller dies (including the high-bandwidth memory discussed earlier) assembled like building blocks and then sealed together with an expensive process step known as advanced packaging. This line item is the value captured in that packaging step. It is currently one of the genuine bottlenecks on AI chip capacity: whoever controls this step has pricing power.
7.9 Accelerator Board and Module Silicon (the chips surrounding the main die)
On an AI accelerator card, beyond the main processor, a whole ring of supporting chips is soldered around it — power delivery, signal retiming, management and more — collectively the board-level support silicon. This line item is simply the separate lens on that surrounding content. It is not itself a new chip type; it is the reminder that alongside the main die, that supporting ring is real value too (and precisely which chips those are is the subject of Layer 8, next).
This layer is the broad ring of non-accelerator silicon that surrounds the accelerator. If Layer 7's accelerator is the team's franchise player, Layer 8 is the rest of the squad around that player: the one calling the plays (the CPU), the one managing power delivery (the power chips), and the ones acting as referee and support staff (management silicon, sensors). Their unit prices are lower and they attract far less attention — but take any one of them away and the star cannot take the field. The economics of this layer: an extremely fragmented field with an enormous number of companies (analog alone is a universe of its own), containing both sub-segments where a handful of giants take everything (server CPUs, for instance) and red oceans where hundreds of firms crowd together. Here it is, item by item.
8.1 Host Server CPUs — x86
CPU stands for central processing unit, the computer's commanding brain. In an AI server, the expensive accelerator does the heavy arithmetic, but a CPU is still needed as the commander — dispatching work and running the machine as a whole. x86 is a CPU instruction-set architecture that has been in use for decades (think of it as a common language standard), and essentially every conventional server and PC runs on it.
8.2 Server CPUs — Arm
Arm is a competing CPU architecture standard, set against x86. It first took hold in mobile phones, where its defining characteristic is power efficiency, and it is increasingly being deployed in data centres — because AI halls consume so much electricity that saving power is saving money. Consider: x86 is the powerful but thirsty large-displacement engine, Arm the fuel-efficient one. Over a long haul — and a data centre runs 24/7 — the fuel saved is considerable.
8.3 Logic ASICs / ASSPs
As covered above, an ASIC is a chip built for a specific task. ASSP stands for application-specific standard product — a chip designed for a class of application but sold openly to everyone. The distinction: an ASIC is customised exclusively for one customer; an ASSP is built once and anyone can buy it. Both handle the specialised odd jobs — networking, display, interfaces and the rest.
8.4 FPGAs as Logic (reconfigurable silicon as glue logic)
The same field-programmable part described above, whose circuitry can still be rewired after it ships — but used here not to accelerate arithmetic, rather as glue logic: absorbing the irregular connection, control and coordination work between the various chips on a board. Consider the custom adapters used in a renovation, joining two lengths of pipe whose specifications do not match.
8.5 Analog / Mixed-Signal
First, digital versus analog. Most of the chips discussed here process digital information — only ones and zeros. But the real world — temperature, sound, voltage, current — is made of continuously varying analog signals. Analog chips are the translators between those two worlds, turning real-world signals into digital form for the main processor, or the reverse. “Mixed-signal” means both digital and analog blocks on one die. This is an enormous and enormously fragmented field, running to hundreds of product categories (amplifiers, converters, interfaces and so on).
8.6 Microcontrollers (MCU)
MCU stands for microcontroller unit. Think of it as a small, cheap miniature computer with brain and limbs integrated into one part. Its compute is weak, but it is more than enough to manage one specific small job: controlling a fan speed, reading a button, running a sensor. They are everywhere — in appliances, cars, and equipment of every description. Inside an AI hall, they quietly run a great many auxiliary functions.
8.7 Digital Signal Processors (DSP)
DSP stands for digital signal processor: a chip built specifically to excel at signal-processing mathematics — stripping noise out of a muddy audio recording, decoding a radio signal. It is exceptionally efficient at the repeated multiply-accumulate operations those tasks require. Consider it a mental-arithmetic prodigy specialised in one type of repeated calculation: it does nothing else, but it does that at extraordinary speed.
8.8 Power Management ICs (PMIC)
PMIC stands for power management integrated circuit. A main processor needs several different supply voltages at once (one rail at 1V, another at 3.3V), each of which must be stable and efficient. The PMIC is the estate manager for power, splitting the incoming supply into each required rail and modulating continuously to save energy. Put simply: it is the main distribution room in a building, dividing incoming mains into the different specifications each floor and each room requires.
8.9 VRMs, Power Stages & Point-of-Load (multiphase and local power delivery)
An AI processor can draw over a thousand amps in an instant — a genuinely alarming magnitude — and ordinary power delivery simply cannot hold it. A VRM (voltage regulator module) is the power stage pressed right up against the main die, driving the voltage precisely to the level the chip demands while sustaining that enormous current. “Multiphase” means many parallel supply paths sharing the load. PoL stands for point-of-load: supplying power right where it is consumed, as close to the chip as possible, because transmitting current any distance incurs loss.
8.10 Discrete Silicon Power MOSFETs
A MOSFET is a power switching device — in plain terms, an electronic switch that can turn a large current on and off extremely fast. Power systems convert and regulate voltage stage by stage precisely by switching these devices hundreds of thousands of times per second. “Silicon” denotes the traditional material (more advanced materials come next). Consider a valve on a pipe that opens and closes at extraordinary speed, controlling flow — here, current — precisely through that rapid switching.
8.11 Wide-Bandgap Power Devices — GaN / SiC
A more advanced class of material than the silicon MOSFET above. GaN is gallium nitride and SiC is silicon carbide, known collectively as wide-bandgap materials. Switches built from them are faster, more efficient and able to withstand higher voltages than conventional silicon. AI halls are migrating to high-voltage DC distribution, which requires exactly this kind of high-efficiency device — making this a track that AI demand has activated. Put simply: silicon is the ordinary valve, wide-bandgap the premium valve that passes more flow in the same envelope with less effort.
8.12 Clocks & Timing
Hundreds or thousands of chips inside one server have to work in concert, and that requires a single metronome keeping everyone on the same beat — the clock chip. It generates the stable frequency reference that synchronises every part. Consider the conductor keeping time for an orchestra: without one, several hundred instruments (chips) descend into chaos. The faster the AI network runs, the tighter the precision that beat demands.
8.13 Sensors & Interface Logic
A data hall has to know, continuously, how hot each location is, how much current is flowing, and whether anything is out of bounds. That sensing is done by sensor chips, which convert physical temperature, current and the rest into digital signals to report upstream. Interface logic is the relay silicon that lets different chips speak to each other and keeps signals accurate in transit. Together they are the hall's nerve endings.
8.14 Baseboard Management Controllers (BMC / IPMI controllers)
BMC stands for baseboard management controller: an independent housekeeping chip on the server motherboard that stays alive even when the server has crashed — or has never been powered on — allowing an administrator to power-cycle remotely, read temperatures and diagnose faults. Put simply: it is the separately powered security desk in a building. When the main block loses power, the desk's lights stay on and someone is still watching the monitors. This is the linchpin of remote data-centre operations.
8.15 Vertical Power Delivery Silicon (VPD, feeding power from beneath the die)
As noted, an AI processor can draw a thousand amps or more — in some cases tens of thousands. At those currents, feeding power in from beside the chip is no longer sufficient; the copper simply cannot carry it. The new approach places the power silicon directly beneath the main die and feeds vertically upward, giving the shortest path and the lowest loss. Consider: rather than running a thick supply pipe from the next room, sink a well directly under the floor and draw straight up. This is a new link that emerged specifically to serve extreme-current GPUs.
8.16 HVDC Conversion Silicon (SST, 1200V wide-bandgap — rack-level high-voltage conversion)
HVDC is high-voltage direct current. AI rack power has climbed so high that hall distribution is migrating from low voltage to ±400V and even 800V DC (the same copper cross-section then carries far more power). That in turn requires conversion silicon able to operate at those voltages, typically built on the wide-bandgap (WBG) materials described above and rated to 1200V. SST stands for solid-state transformer — delivering the function of a conventional transformer in silicon.
8.17 eFuses, Hot-Swap & Load Switches (make-break protection silicon)
Servers have to support hot-swap — replacing a component without powering the machine down — or the hall cannot be maintained at all. But the instant of a live insertion produces an enormous inrush current that can destroy hardware. This class of chip is the smart fuse that controls that inrush gently on insertion and cuts off instantly on fault to protect what is downstream. An eFuse is an electronic fuse: faster to react than a conventional fuse, and resettable.
8.18 Gate Drivers & Isolation (digital isolators)
The power switches above — MOSFETs, GaN, SiC — have to be turned on and off with precision, and it is the gate driver that issues those commands. Between the high-voltage and low-voltage domains, a further electrical firewall is mandatory to stop high voltage crossing into the control circuitry and destroying both people and silicon. That is the job of the digital isolator: the signal passes, the dangerous voltage does not. Consider the armoured glass at a bank counter — speech goes through, danger does not.
This final block covers everything on the board that is not a chip: the great mass of tiny components — capacitors, resistors, inductors, connectors, relays. They cost fractions of a cent apiece, and a non-specialist would never give them a second look. Two things are worth holding onto, though. First, an AI server uses thousands upon thousands of them, and in aggregate that is real money. Second, the more extreme AI chip power becomes, the more demanding the performance requirements on these small parts get: one missing, or one slightly out of tolerance, and a machine worth several hundred thousand dollars has a problem. The economics of the layer: extreme fragmentation, very low unit prices, and a business won on scale, yield, and getting designed into NVIDIA's bill of materials. Here is each category.
8B.1 Capacitors
A capacitor is a miniature battery and voltage stabiliser in one. It can store a small charge instantaneously and release it just as fast, which lets it hold voltage steady and filter out noise when a chip's current draw swings sharply. An AI processor's draw swings violently, so a dense field of capacitors is laid out immediately around each die. There are many families: MLCC (multilayer ceramic capacitors, the highest volume by far), tantalum, aluminium electrolytic, and film. Consider a capacitor as a header tank: when the tap (the chip's draw) opens and closes abruptly, the tank keeps the pressure steady.
8B.2 Resistors & Shunts (current-sense resistors)
The resistor is the most elementary component of all, impeding current and dividing voltage. A shunt is a specialised precision resistor placed in series in the circuit: measuring the tiny voltage across it lets you infer how much current is flowing. That is how a data hall knows precisely how much power each chip is drawing at any moment. Consider a shunt as a water meter, computing flow from the pressure drop across a short section of pipe.
8B.3 Inductors & Chokes
An inductor is a wound coil, and its role complements the capacitor's: capacitors steady voltage, inductors steady current and smooth out its spikes. In the multiphase VRM power delivery described earlier, every phase needs its own inductor, so an AI motherboard carries a great many of them. A choke is a form of inductor dedicated to choking off unwanted high-frequency noise. AI's high currents have given rise to demanding new categories such as TLVR (a coupled-inductor topology).
8B.4 Magnetics & Transformers
A transformer uses the magnetic field between two coils to convert one voltage into another, stepping up or down and also isolating two circuits from each other (the armoured glass described in the isolation section is sometimes built this way). What is covered here is the small board- and module-level magnetics and transformers, plus their core raw material: ferrite cores (a magnetically permeable ceramic that forms the skeleton of the coil). AI's high-voltage DC architecture — the solid-state transformer, SST — is generating new demand for magnetics.
8B.5 Ferrites & EMI Filters
Any working circuit radiates electromagnetic noise (EMI, electromagnetic interference), which both disturbs other equipment and is subject to regulation. A ferrite bead is a small magnetic bead slipped over a signal line to absorb high-frequency noise; an EMI filter is a more complete suppression module. Consider them the silencer fitted to the circuit, damping the noise down.
8B.6 Board-Level Circuit Protection
Circuits fear two things: too much current (overcurrent) and a sudden voltage spike (a surge, from a lightning strike or static discharge). This family of components blocks both. Fuses melt open on overcurrent; TVS and ESD diodes absorb transient overvoltage and shield static-sensitive silicon; MOVs and GDTs handle heavier surges; and PTC/NTC devices limit the inrush at power-up. They are the lightning rod and airbag of the circuit board.
8B.7 Frequency Control Passives (crystals and resonators)
The clock chips described earlier cannot produce a precise beat without a reference tuning fork: the quartz crystal. Quartz vibrates at an exceptionally stable frequency when energised, supplying the whole system with its reference. Higher-end variants include TCXOs and OCXOs (temperature-compensated and oven-controlled crystals, far more accurate) and the emerging MEMS resonator (substituting a micro-mechanical structure for quartz). Consider the crystal as the orchestra's tuning fork: every instrument takes its pitch from it.
8B.8 Relays & Electromechanical Components
A relay is a mechanical switch that uses a small current to make or break a large one — there really is a piece of metal inside physically pulling in and releasing. A contactor is the higher-power version, used to break and make main circuits carrying hundreds of amps (both hall power distribution and backup-supply transfer rely on them). Unlike a purely electronic switch, it acts through genuine metal contacts, which is why it wins on large-current capability and complete isolation. AI halls' move to high-voltage DC has created a distinct HVDC contactor category.
8B.9 Board Connectors, Sockets & Cable
A connector is the plug-and-receptacle that mates two boards, or a cable to a board. A socket refers specifically to the seat that holds a CPU or memory module, letting the part be inserted and replaced rather than soldered permanently. Signal speeds inside an AI server are extreme and pin densities extraordinarily high, pushing connector precision requirements to the limit — which has, paradoxically, promoted the connector from an unremarkable small part into a link with a real technical barrier and an AI premium attached. Consider: a connector is a power strip, but what an AI hall needs is the top-specification strip that carries ultra-high-speed signals without a single error.
8B.10 Busbars & Board-Level Power Distribution Hardware
When current grows beyond what ordinary wire can carry, conduction shifts to thick slabs of metal — the busbar. What is covered here is the laminated busbar and copper conductor at board and module level (the rack- and hall-level busway belongs to the power layer). The thousand-amp currents an AI processor draws have to be delivered across the board by exactly this kind of copper. Consider a busbar as replacing many thin pipes with one large main, sized for high flow.
What this layer is. The chip does the computing, but it needs somewhere to put the data while it works. This layer is every component that gives the AI factory its memory. Put simply: memory is the chip's workbench, where whatever is being computed sits temporarily — extremely fast, but wiped the instant power is lost. Storage is the warehouse, holding data for the long term, surviving power loss, but slower to retrieve from. AI's appetite for memory is frightening: the memory bonded alongside a top-end AI chip is worth more than the chip itself.
Its economic character. The memory business has an old temperament: it is a cyclical, with prices swinging hard on supply and demand — shortage and price spikes in the upswing, collapse when it turns. But the highest tier of AI-era memory (HBM) is being walled off from competitors by certification, and is shifting from a pure cyclical toward a toll-collecting position. Hard drives, within storage, look more like a stable commodity business. Globally, only three firms can make high-end memory — SK hynix, Samsung and Micron — and that degree of concentration is itself the root of the pricing power.
9.1 High Bandwidth Memory (HBM)
HBM stacks multiple memory dies vertically, like storeys of a building, then connects them into a single block through extremely fine vias (TSVs — through-silicon vias, the industry's term, functionally the lift shafts between floors). It sits immediately alongside the AI chip, delivering extraordinarily fast reads and writes and an extremely wide transfer bandwidth. Consider: ordinary memory is a single-lane road, HBM a motorway several dozen lanes wide — the only way a data torrent avoids gridlock. It is the most critical, and the most expensive, component attached to an AI chip today.
9.2 Server Main Memory / DDR5
DRAM (dynamic random-access memory) is the chip inside what people call a memory module — the primary workbench on which data is laid out while the processor computes. DDR5 is the current generation of the standard (fifth-generation double data rate), faster and more power-efficient than its predecessor. Beyond the HBM bonded to the accelerator, an AI server also carries a large complement of this conventional main memory, providing the machine's large working surface.
9.3 CXL Memory Expanders
CXL (Compute Express Link, a new channel standard for high-speed processor-to-memory links that also allows multiple processors to share one copy of the data) permits memory to be moved a little further from the chip and pooled for several processors to draw on. A memory expander is the interface card for that remote memory: when the slots beside the processor run out, it extends capacity further. Consider: instead of each desk carrying its own workbench, the office moves to a shared storage area anyone can draw from.
9.4 NAND Flash
NAND flash is the medium that holds data in the warehouse, retaining it without power. It is the core material in solid-state drives and USB drives. It is graded by storage density — the denser, the cheaper and the slower (TLC, QLC and so on in industry shorthand). An AI factory has to stockpile vast quantities of training data, and demand for this high-capacity medium rises accordingly.
9.5 Enterprise SSDs
An SSD (solid-state drive) assembles a set of NAND flash dies plus a controller into a drive that is purely electronic, with no mechanical platter. The enterprise version is the one built for data centres: more durable, more reliable and higher capacity than consumer parts. It reads and writes far faster than a mechanical drive, making it the main warehouse for hot data — the data pulled frequently — inside an AI factory.
9.6 SSD / Memory Controllers
Beyond the flash that holds the data, a solid-state drive contains a brain chip that directs which flash cell each piece of data goes to, corrects errors as cells fail, and manages endurance (that logic is known in the industry as the FTL, or flash translation layer). That brain is the controller. Without it, a pile of flash is just loose material and will not assemble into a usable drive.
9.7 Memory Modules — RDIMM / MRDIMM
A DIMM is the memory module that plugs into the server board. An RDIMM (registered DIMM) adds a buffer chip so a server can carry far more modules reliably and without error; the MRDIMM (multiplexed DIMM) is the newer generation, fitting greater capacity into the same slot and running faster. AI servers demand a great deal of memory, and volumes of these high-specification modules rise with it.
9.8 Module Companion Silicon
Beyond the memory dies, a module carries several inconspicuous but indispensable small chips: one buffers commands and marshals the signals (the RCD, or registering clock driver), another relays the data (the data buffer), and another handles temperature sensing and identity records (the SPD hub). Together they let a fully populated module run fast and stably.
9.9 Near-Memory / Processing-in-Memory (PIM)
Conventionally, data sits in memory and the processor fetches it to compute — and that round trip costs both power and time. Processing-in-memory (PIM) proposes doing the simpler computations inside the memory itself, saving the trip. Consider: rather than hauling all the goods back to head office to be counted, count them in the warehouse. This is an early-stage architecture aimed at routing around the data-movement bottleneck.
9.10 Emerging Non-Volatile Memory (NVM)
Non-volatile memory (NVM) means storage that retains data without power. This line item is the collective term for a group of technologies still between laboratory and low-volume production: MRAM (magnetic memory, recording ones and zeros in magnetic orientation), ReRAM (resistive memory, recording data as high or low resistance), PCM (phase-change memory) and FeRAM (ferroelectric memory). Each is trying to be both fast and non-volatile at once; all are currently confined to niche applications, and none is close to displacing mainstream memory at scale.
9.11 Nearline Hard Disk Drives (HDD)
An HDD is the traditional drive with spinning platters and read/write heads inside — slower than an SSD but far cheaper per gigabyte. “Nearline” denotes its use for warm and cold data: infrequently accessed, but occasionally needed. Most of the vast data AI training generates is not in daily use, and stockpiling it on cheap high-capacity drives is by far the most economical option. The latest generation uses laser-assisted writing (HAMR, in industry shorthand) to push capacity further.
9.12 Storage Systems & Arrays
Pack hundreds or thousands of drives into racks, add management software, and the result is a complete appliance providing storage as a service — the storage array. An all-flash array is the high-speed version built entirely from SSDs; parallel file storage is the specialised system that lets thousands of AI chips read the same body of data at high speed simultaneously. That is a hard requirement of AI training: hungry chips need to be fed, and if storage is slow, even the most expensive silicon sits idle.
9.13 HBM Base / Logic Die
Underneath the stack of memory dies in an HBM part sits a special foundation die, responsible for directing how the whole stack converses with the AI chip outside it. The newest generation (HBM4) makes that foundation progressively more complex — complex enough that it is now built on leading-edge logic processes. Which means even the foundation of a memory part now has to be fabricated by a top-tier foundry such as TSMC, binding memory and advanced logic manufacturing together.
9.14 DIMM Buffer Silicon — RCD / DB / MUX
This line item breaks out the most important of the companion chips in 9.8: the RCD (registering clock driver, marshalling and amplifying the command signals), the DB (data buffer, relaying and accelerating the data signals), and the MUX (multiplexer, pushing more data down a single line). The faster a module runs and the more densely it is populated, the more indispensable these signal-steadying chips become.
9.15 SOCAMM / LPDDR Modules for AI Servers
LPDDR was originally the low-power memory built for phones — energy-efficient and low-heat. To save power and space, AI servers have begun bringing that low-power memory in as purpose-built pluggable modules (SOCAMM and other new form factors). Consider: what used to be the large, power-hungry desktop-style module becomes a compact, efficient laptop-style one — and both power draw and density matter more to an AI rack with every generation.
9.16 Memory-Side Retimers
Once memory is moved away and pooled for sharing (see 9.3, CXL), signals travelling that distance attenuate and distort. A retimer is the relay station along the way: it re-reads the degraded electrical signal cleanly and retransmits it at full strength, so data can reach more distant memory without error. Consider passing a message down a long line — it is easy to mishear, so you station someone in the middle to repeat it clearly before it travels on.
What this layer is. An AI factory does not run one chip on its own; thousands of chips have to work as a single team on the same enormous problem, which requires connecting them into one whole through extremely fast links. This layer is every component that carries data as an electrical signal: switches, network cards, and the various copper cables and connectors. Put simply: a switch is the telephone exchange, deciding who gets connected to whom and routing the call. The moment the links between chips are not fast enough, even the most powerful silicon sits waiting on its neighbours, and half the cluster's compute is thrown away.
Its economic character. This layer is sharply polarised. Upstream, switch silicon (the chip that determines how data is routed) is a high-margin, deeply moated business belonging to Broadcom, NVIDIA and a few others. Downstream, copper cable and connectors are a thin-margin, cost-competitive field crowded with Taiwanese and mainland Chinese manufacturers. NVIDIA's proprietary fabrics — NVLink and InfiniBand — go further still, binding “selling the chip” to “locking in the entire ecosystem,” which is one of its deepest moats. So “bullish on AI networking” again demands the prior question: which stretch do you mean?
10.1 Ethernet Switch Systems
A switch is a device dedicated to connecting and forwarding: data from a great many servers converges on it, and it decides where each packet goes next. Ethernet is the world's universal networking standard. An AI factory holds rows of switches weaving every chip and server into one high-speed fabric. The system-level business is assembling switch silicon, chassis and software into a working box sold to the customer.
10.2 Merchant Switch Silicon
At the core of that exchange sits the chip that determines how much data can be forwarded per second, and how — the switch ASIC. “Merchant” means it is sold as a standard part to equipment makers generally, rather than reserved for one company's own use. A leading-edge part forwards over 51.2 terabits per second (51.2T in industry shorthand), and it is the master switch on how fast the whole fabric runs.
10.3 Network Interface Cards (NIC)
The NIC is the part fitted to each server that lets it speak on the network; without one, a server is an island with no telephone. Chips in an AI cluster exchange data furiously, so the cards used are the high-speed versions. Among them, cards supporting RDMA (remote direct memory access, which lets one machine bypass the usual software path and read another machine's memory directly) cut transfer latency substantially, and are standard equipment for AI training.
10.4 SmartNICs / DPUs
An ordinary NIC only sends and receives. A SmartNIC, or DPU (data processing unit), adds a small processor onto the card that takes over networking, security and storage chores from the main processor, so the expensive AI silicon can concentrate on mathematics rather than housekeeping. Consider: give the senior executive a capable assistant to absorb the administrative work, leaving them free to do only the highest-value thing.
10.5 Retimers / Redrivers / Gearboxes
A high-speed electrical signal travelling any distance across a board attenuates and distorts. A retimer reads the signal out completely, regenerates a clean copy and retransmits it (a full refurbishment); a redriver simply amplifies what is there (a transfusion); and a gearbox converts between different data rates. All three are relay stations on high-speed links, and the higher the rate and the longer the distance, the more indispensable they become.
10.6 Active Electrical Cables (AEC)
An ordinary copper cable's signal collapses beyond a certain distance. An active electrical cable (active meaning it carries powered silicon of its own) embeds retimer chips at each end of the copper, cleaning the signal as it travels, so the cable reaches further while remaining cheaper and more power-efficient than optics. Consider adding a booster pump partway along a run of pipe so the water reaches further. It is the value choice for medium-distance connections inside the rack.
10.7 Passive Copper / DAC
A DAC (direct attach copper cable) is a pure-copper short-reach link with no silicon in it at all — “passive” meaning nothing inside requires power. It is the cheapest, most power-efficient and most reliable option, with the drawback that it only reaches a very short distance (a metre or two). Where chips sit close together inside a rack, copper is used wherever copper will do, because optics are both expensive and power-hungry.
10.8 High-Speed Connectors & Backplanes
A connector is the physical interface that mates two boards or two cables; a backplane is the large base board into which multiple circuit boards plug to interconnect. Data moves extraordinarily fast inside an AI rack, so precision requirements at these mating points are extreme — a small deviation and data is lost. They attract no attention, but every machine holds hundreds or thousands of them, and not one can be missing or defective.
10.9 PCIe Switch Fabric
PCIe (Peripheral Component Interconnect Express, the standard high-speed channel between a computer's CPU and its various cards) originally supported one device per link. A PCIe switch acts as a splitter, fanning one channel into many so a single CPU can host far more GPUs, drives and network cards. Consider: one socket is not enough, so you add a safe, high-speed strip that splits it into several. AI servers carry a great many devices and depend on this for expansion.
10.10 CXL Fabric Switches
As noted above, CXL is the new channel that lets processors and memory share one copy of the data. A CXL fabric switch is the exchange within that shared network, flexibly interconnecting multiple processors with a large pool of shared memory so any of them can attach when needed. It is the key link in turning memory into a public resource pool — still early, but widely regarded as the future direction of AI memory architecture.
10.11 Scale-Up Fabric — NVLink / UALink
“Scale-up” means binding dozens of GPUs within a single rack tightly enough that they behave as one giant chip, each able to reach the others' memory as if it were its own and work the same problem together. NVIDIA's NVLink is the de facto standard for this — extremely fast, and available from nobody else. UALink is the open alternative developed jointly by other vendors. Consider wiring a row of people's brains together neurally so that they think as one. This is the critical amplifier on an AI cluster's effective compute.
10.12 InfiniBand
InfiniBand is a networking technology purpose-built for high-performance computing, delivering lossless transport at very low latency: extremely fast, and essentially error-free. It is popular in AI training because when thousands of chips compute in lockstep, none can afford to fall behind because the network stalled. It comprises dedicated switches and network cards (HCAs, or host channel adapters, in industry shorthand). The technology is almost exclusively controlled by NVIDIA.
10.13 Network OS / Electrical DCI
This item covers the hardware side of two things. First, decoupling the switch's operating system from its hardware (letting the user swap network software as freely as installing a PC operating system — the open-source approach is known as SONiC). Second, the electrical transport equipment for data centre interconnect (DCI, linking two geographically distant data centres over high-speed lines). The larger AI gets, the more it needs several halls joined into one larger whole.
10.15 PCB Midplane / Backplane Assemblies
This is the high-speed base board inside the rack — the midplane or backplane — into which every compute board plugs to become fully interconnected, together with the complete any-to-any wiring it carries. Dozens of chips in an AI rack must each connect directly to every other at high speed, which places extreme demands on the board's layer count and precision. It is the physical substrate on which scale-up fabrics such as NVLink are actually realised.
10.17 Plastic Waveguide / e-Tube (emerging)
A new medium sitting between copper cable and optical fibre: a purpose-made plastic tube that guides a high-frequency signal the way a fibre guides light, aiming to combine copper's low cost with optics' reach and efficiency. It remains at an early, pre-productisation stage, pushed mainly by start-ups. Consider building the electrical signal a dedicated slide so that it travels further with less effort.
What this layer is. An electrical signal attenuates over distance and burns power doing it, so once a run inside the datacentre gets long enough, the electrical signal is converted into light, carried over fibre, and converted back into electricity at the far end. This layer is the sum of everything that performs that electrical-to-optical and optical-to-electrical conversion, plus every component the light passes through on the way. Put simply: an optical transceiver is an electro-optical translator — at one end it renders the chip's electrical signal into light and launches it into the fibre, at the other it translates it back. The larger the AI cluster and the heavier the chip-to-chip traffic, the more transceivers are required; this is an unglamorous but very large cost line inside an AI network.
Its economic character. We break this layer out separately because both its corporate universe and its chokepoints differ from ordinary networking. It has a clean product cycle (400G → 800G → 1.6T in successive upgrades, where G denotes transmission rate), and the leaders harvest the technology premium at respectable gross margins. It also carries real roadmap risk — newer approaches such as LPO and CPO could upend the incumbent structure. Strong vendors sit on both sides of the US–China divide: the US names lead in lasers and high-end silicon, the mainland Chinese names in module assembly and cost.
11.1 Pluggable Optical Transceivers
This is the mainstream form of that electro-optical translator: a small box that plugs into a switch port, integrating the laser, the silicon and the rest, converting electrical signal into transmitted light and received light back into electricity. “Pluggable” means it can be inserted and swapped like a USB stick. Generations are defined by rate (400G/800G/1.6T; higher is faster), and this is the highest-volume, most directly AI-levered product in the entire optical layer.
11.2 Optical Engines
An optical engine packages the optical and electrical halves of a transceiver into a more compact sub-assembly — the translator's core movement, pre-built and handed downstream for integration. It is the intermediate step from the pluggable module toward tighter integration sited closer to the chip, and it lays the groundwork for more advanced packaging such as CPO (next item).
11.3 Co-Packaged Optics (CPO)
Conventionally the optical module plugs in at the edge of the switch. CPO moves the optical engine into the same package as the switch silicon or the AI chip, sitting flush against it, so the optical path shrinks to its minimum, saving power and raising speed. Consider bringing the translator from the doorway to a seat at the negotiating table: less walking, less energy burnt. This is the next-generation direction the industry argues about most, and it could reshape the whole optics-and-switching structure — but volume production is still early.
11.4 Silicon Photonics / PIC
Silicon photonics uses mature chip-fabrication processes to build optical functions — modulating and guiding laser light — directly onto a die (the industry calls that die a PIC, or photonic integrated circuit). The advantage is that optical devices can then be made at scale and at low cost exactly as ordinary chips are. It is the underlying technology platform for CPO, high-end transceivers and other advanced optical approaches.
11.5 Lasers — EML / DFB / CW
The laser is the source of light inside a transceiver; without it there is no optical signal to send. This item covers the high-end laser classes used for long-reach, single-mode fibre: EML (electro-absorption modulated laser), DFB (distributed feedback laser) and CW (continuous wave). They are built on a specialised semiconductor material, indium phosphide (InP), the technical barrier is high, and they are among the most valuable core materials inside a transceiver.
11.6 Lasers — VCSEL
The VCSEL (vertical-cavity surface-emitting laser) is a different laser class that emits vertically from the die surface; it is cheap and easy to manufacture at volume, but suits only short-reach transmission. It is used mainly in multimode modules on intra-rack and other short links. Consider DFB/EML the finely engineered long-haul engine and the VCSEL the economy short-haul unit — each owning its own stretch of distance.
11.7 Optical DSP / PHY
An optical signal usually arrives distorted. The optical DSP (digital signal processor) is a chip dedicated to correcting and restoring it, spending compute to reconstruct the degraded waveform so that long-reach, high-rate transmission still arrives faithfully. It is the highest-value chip in a high-end transceiver after the laser itself. But the newer LPO approach (next item) aims to design it out, which introduces genuine uncertainty here.
11.8 Linear-Drive Optics (LPO)
LPO (linear pluggable optics) is a newer approach that dispenses with the power-hungry optical DSP, using simpler linear amplification to drive the optical devices directly — lower power, lower cost, lower latency, at the price of far more demanding system design. It is the direction AI clusters are embracing in the pursuit of power savings, and it is encroaching on the traditional optical DSP's territory.
11.9 External Laser Source (ELS)
In advanced approaches such as CPO and silicon photonics, a laser packaged alongside the chip radiates heat into it and is hard to repair when it fails. The external laser source moves the laser outside, standing alone, and pipes its light in over fibre — separating the thermal load and allowing the laser to be replaced on its own. Consider mounting the engine outside the car: easier to cool and easier to service.
11.10 Optical Connectors / Fibre / MPO
This item is the fibre itself plus the connectors that join it (the multi-fibre interface that terminates many strands at once is called MPO/MT). An AI hall holds thousands of fibre strands, and these connectors are what dock them tidily and reliably. Tolerances are tight: a slightly contaminated or misaligned interface and the light simply does not get through.
11.11 Passive Optical Components
“Passive” means these small devices draw no power and amplify nothing; they act on the light passively. They include isolators (letting light travel one way only, suppressing reflection), filters (selecting a specific wavelength), multiplexers and de-multiplexers (combining many optical channels onto one fibre or splitting them apart, known in the trade as WDM), and splitters. They are the inconspicuous but indispensable fittings of the optical path, combing, routing and cleaning up the light.
11.12 Optical Circuit Switching / Coherent DCI / Photonic Packaging
This item covers three high-end activities: optical circuit switching (OCS, switching the light directly without converting to electrical first — Google already runs it at scale in its own AI network); coherent DCI (using advanced modulation to push very-long-reach datacentre-to-datacentre optical transport to extremely high capacity); and dedicated foundry packaging for photonic devices. All three push optics toward greater scale and greater distance.
11.13 Electro-Optic Modulators — MZM / EAM / TFLN
The modulator is the device that inscribes the electrical signal onto the light. The laser only emits a steady beam; the modulator switches and varies that beam rapidly in step with the data, which is how information is loaded into the light. Several technology routes compete: silicon-based MZM, indium-phosphide EAM, and the higher-performing thin-film lithium niobate (TFLN). The higher the rate, the more punishing the demands on the modulator.
11.14 Receiver Photonics — PIN / Ge / APD / TIA
When the light reaches the far end, something has to turn it back into an electrical signal. Photodetectors (PIN, germanium detectors, APD avalanche photodiodes) convert faint light into a faint current; the TIA (transimpedance amplifier) sits immediately behind, amplifying that faint current into a usable signal. Together they form the receive side of the transceiver, bookending the laser on the transmit side.
11.15 In-Package Micro-Optics — FAU / Isolators
Approaches such as CPO and silicon photonics that move optics inside the chip package require a set of very small optical parts to dock fibre to die precisely: the FAU (fibre array unit, holding many fibres in fixed alignment to the chip), edge couplers, micro-lens arrays, in-package isolators and the like. What they solve is the exquisitely fine alignment problem of getting light accurately into and out of the photonic die.
11.16 Semiconductor Optical Amplifier (SOA)
Light weakens as it travels. The SOA (semiconductor optical amplifier) is a chip that amplifies light in place, topping it up in shared-laser and long-reach settings so it can travel further or be divided among more channels. It is the gain device underpinning external laser sources and long-reach architectures.
11.17 Hollow-Core Fibre (HCF)
Ordinary fibre is solid glass, and light travelling through glass is marginally slower and lossier. Hollow-core fibre confines the light mostly to a hollow air core, giving lower loss and higher speed (light moves faster in air than in glass). It is compelling in AI settings chasing the last increment of latency, but it remains a frontier speciality fibre made in small volumes.
The preceding layers manufacture the chips, the memory, the networking, the power delivery and the cooling hardware — but a pile of parts is not a working machine. This layer is the final assembly floor, fitting GPUs, CPUs, memory, network cards, cold plates, power supplies, fans and cabling into a board, a chassis and a rack, testing and burning them in, and shipping a complete rack to the datacentre where it need only be energised to run. It sits in the lower-middle of the chain, the assembly bridge between silicon and datacentre.
The economics of this layer turn on a stratification that recurs throughout this report. The overwhelming majority of players are Taiwanese and mainland Chinese contract manufacturers (ODM/EMS) competing on thin gross margin, scale, lead time and yield — the textbook commodity/cyclical business, with no pricing power, earning on the sheer volume that AI throws off. But a handful of positions on that line have become scarce precisely because AI rack complexity has exploded: rack-scale integration of the NVIDIA NVL72 variety, leak testing and burn-in of full liquid-cooled racks, high-layer-count high-speed PCBs. At these nodes the technical and qualification barriers rise abruptly, and a little of the toll-booth character starts to appear. So this layer cannot be viewed in aggregate; you have to distinguish who is fighting on price from who has locked up a new technical barrier.
12.1 AI Server ODM (Original Design Manufacturer)
The ODM (original design manufacturer) is the principal contract manufacturer on this chain: the customer — a cloud provider, say — states the requirement, and the ODM designs it, builds prototypes, then manufactures complete AI servers at scale, finally badging them for the customer or delivering them directly. The distinction from a branded vendor is that the ODM does not normally sell to the end user under its own name. Consider the contract factories of the apparel trade: the label supplies design and orders, the factory makes the garment. Sub-items here include AI server ODM work, hyperscaler reference-platform manufacturing (building to a standard design supplied by the hyperscaler), board-level integration services, and EMS contract manufacturing (electronics manufacturing services, pure build-to-print assembly).
12.2 Branded AI Servers (AI Server Branded OEM)
OEM (original equipment manufacturer) here means the server vendors that carry their own brand and sell complete solutions and services. Relative to an ODM they add brand, sales channel, enterprise-grade technical support and after-sales service; the customer buys not merely a machine but a warranty of continuity around it. Sub-items include branded AI server platforms, HPC-dedicated servers (high-performance computing) and full solutions with enterprise support. Consider buying the same server two ways: going to the OEM is like buying a branded computer with nationwide warranty cover, where somebody answers when it breaks. That is why they earn an additional layer of service and brand margin above pure contract manufacturing.
12.3 GPU Baseboard & Compute Tray
The baseboard is a large circuit board carrying several GPUs soldered or socketed together at once (NVIDIA's HGX eight-GPU baseboard, for instance), so that those GPUs are interconnected at high speed on the board itself. The compute tray then packs the baseboard, CPUs, memory, power delivery and cold plates into a drawer-style module that slides into the rack. Consider the baseboard a motherboard with eight brains plugged into it, and the tray the drawer holding that motherboard and sliding in and out as a unit. Sub-items include multi-GPU baseboards, accelerator compute trays, GPU carrier boards, accelerator switch trays, tray power distribution boards and tray management controller boards. This is the highest value-density assembly step in the entire machine, and the one closest to the silicon.
12.4 Rack-scale Integration
This is the genuinely new — and most critical — segment thrown up by the AI era. Servers used to be sold one box at a time and racked up on site; now, with something like NVIDIA's GB200 NVL72, 72 GPUs, switches, power delivery, liquid cooling and cabling are pre-integrated in the factory into a complete rack-level SKU (a product number ordered and delivered as a single unit), shipped to site and put to work as soon as power and water are connected. Consider the difference between buying a pile of flat-pack parts and assembling them at home, and buying a fully built, fully tested show flat and moving it wholesale. Sub-items include rack-level reference design integration, integrated compute rack SKUs and rack-level validation services. This segment consolidates scattered contract work into a single high-complexity, high-barrier integration business.
12.5 Thermal Fans & Heatsinks (in-system air cooling)
Even once liquid cooling is adopted, a great many components in the rack still rely on air, and this segment is the air-cooling hardware inside the machine. The heatsink is the block of metal seated on the chip, covered in fins to enlarge the surface area, from which a fan carries the heat away. Within it, the vapour chamber (an evacuated flat cavity that spreads heat rapidly by vaporising and condensing a liquid) and the heat pipe (a slender tube working on the same principle) are the efficient devices that move heat from the chip and spread it across the fins. Sub-items include server fan modules, heatsink fin stacks, vapour chambers, heat-pipe modules, air-baffle kits and fan speed control boards. Consider the vapour chamber a sheet of conductive iron that instantly smooths a single hot point across a whole surface.
12.6 Chassis, Enclosure & Mechanical
This is the skeleton and shell of the machine: the chassis, the metal box holding the motherboard and components; the rack frame, the large steel cabinet in which servers are stacked; plus sled rails (the runners that let a server slide out like a drawer), tool-less service mechanisms (removable by hand, without a screwdriver), EMI shielding (containing electrical noise that would disturb neighbouring equipment) and mounting frames for liquid-cooling manifolds. Consider these the shelving and drawer runners of the rack: unglamorous, but AI racks are heavy and densely packed, and poorly executed mechanical work leaves the whole rack unstable and awkward to service. Liquid-cooled AI racks demand far more of structural strength and load rating than traditional racks did.
12.7 Motherboard & PCB Integration
This segment is the precision assembly that solders chips and components onto the board. The PCB (printed circuit board) is the foundation slab carrying all the silicon. What makes an AI server hard is that signals run extremely fast, the board carries a great many layers (high-layer-count HDI, high density interconnect), and it requires backdrilling (removing the redundant portion of a plated through-hole so it does not distort the high-speed signal). Consider an ordinary motherboard a two-storey house and an AI motherboard a thirty-storey tower where the wiring on each floor must not interfere with any other; the yield and process barriers to building such a board are steep. Sub-items include server motherboard assembly, accelerator baseboard PCB assembly, high-layer-count HDI server PCBs, backdrilled high-speed PCBs, board-level BGA rework and functional board test.
12.8 Edge & On-prem AI Appliances
Not all AI runs in a large datacentre. Edge refers to small deployments close to the user, in the field; on-prem (on-premises) refers to equipment an enterprise deploys in its own machine room. This segment turns AI compute into self-contained, ready-to-run appliances with hardware and software included. Sub-items include edge AI inference appliances, ruggedised AI boxes (tolerant of heat, vibration and dust, for factory and outdoor use), enterprise on-prem AI appliances, micro-datacentre appliances and telecom edge AI servers. Consider compressing a small datacentre into a single rack or even a single box, carried to the factory floor, the retail store or the base station and put straight to work — the data never travels back to the cloud, so response is faster and privacy better preserved.
12.9 System Test & Burn-in
An assembled machine cannot simply be shipped; it must first be tortured to make sure it does not fail on arrival. Burn-in runs the machine at high load and high temperature for a long stretch, forcing the units prone to early-life failure to reveal themselves and be culled. Consider the extreme road test a new car undergoes before it leaves the plant: far better it break in the factory than strand the customer on the motorway. Sub-items include rack-level functional test, GPU cluster burn-in, thermal soak system validation (verifying cooling and stability under sustained heat), interconnect validation and acceptance-test documentation services. An AI rack is worth several million dollars, and a failure on the customer's floor means enormous downtime cost — which is why this gate matters more and more.
12.10 Internal Cable Harness & Wire Management
An AI rack contains hundreds or thousands of individual runs: power, high-speed signal, fibre, sensor wiring. This segment builds those runs into orderly harnesses (a pre-bundled, pre-terminated loom) and manages how they are routed. Sub-items include internal power harnesses, high-speed signal harnesses, liquid-cooling sensor harnesses, cable management arm assemblies (the articulated arm that lets cabling extend with a server pulled out of the rack without tearing), cable labelling and traceability kits (every run tagged for maintenance) and in-rack fibre harnesses. Consider several hundred cables left in a tangle: the cooling airflow is blocked and no technician can tell one run from another. How well the cabling is dressed bears directly on both thermal performance and serviceability.
12.11 Copper Cable Cartridge & Backplane Spine
In a rack such as NVIDIA's NVL72, all 72 GPUs must be fully interconnected (each able to reach every other directly), and that is done with a dense set of copper cables. This copper assembly is built into a cartridge or spine — a copper backplane running up the back of the rack like a vertebral column — and plugged in at the rear. Consider it the rack's central nerve trunk, joining every GPU behind the machine over the shortest, fastest copper path into a single super-unit. Sub-items include passive copper expansion cartridges (no active silicon, pure copper conductors), rack spine copper cable assemblies and blind-mate copper cartridges. This is the physical realisation of in-rack high-speed interconnect such as NVLink, and the signature new component of the AI rack.
12.12 Fan Wall & Sidecar Mechanical
High-power racks frequently add a sidecar — an auxiliary cabinet hung beside or behind the main rack — specifically to house fan walls, power or cooling modules, because the main rack is already full. The fan wall is an entire wall of fans forcing or drawing air through the rack as a unit. Sub-items include rack fan-wall sidecars, power sidecar mechanical frames, cooling sidecar sheet metal, serviceable filter-fan modules and sidecar airflow plenums. Consider adding an outbuilding beside a tower block to house the large fans and power gear the main structure cannot accommodate. AI rack power is high enough that the sidecar has become the standard way of absorbing the extra cooling and power.
12.13 Rack-scale Final Assembly, Burn-in & Service
This is the last mile of the entire chain: assembling every part and subsystem into a complete rack, running full-rack test and burn-in, and shipping it to the customer's site. For liquid-cooled racks there is one further critical operation — the leak test, pressurising the whole rack's cooling loop and confirming that not a drop escapes before it can ship. Sub-items include full-rack assembly services, liquid-cooled rack leak testing, rack-level burn-in services and rack packing and logistics. Consider the final inspection and hand-over of a fully fitted apartment; with a liquid-cooled rack in particular, a failed leak test means several million dollars of silicon could be destroyed the moment water is introduced. This segment is what turns a rack from a heap of parts into a finished product ready to be energised.
Start with the overall picture. In the preceding layers, companies such as NVIDIA and Broadcom design the chip — they draw the blueprint — but they do not manufacture a single wafer themselves. A company that only designs and never builds is called fabless. The blueprint has to be handed to someone who actually owns a factory, and this layer is those factories. They do three big things: (1) build transistors on a silicon wafer, layer by layer, in a cleanroom — wafer fabrication; (2) cut the finished dies out of the wafer they are still attached to, seal them in a housing and connect the pins — assembly and test; and (3) an increasingly decisive new activity in the AI era: fitting several dies together into one package like building blocks so they work in concert — advanced packaging. The economic character of this layer: extremely capital-heavy (an advanced fab routinely costs tens of billions of dollars), highly oligopolistic, and the most geopolitically sensitive of all, since the overwhelming majority of leading-edge capacity is concentrated in Taiwan and South Korea.
13.1 Pure-play Foundry
A pure-play foundry builds chips for others and sells no chips under its own brand. Consider a world-class printing house: you (NVIDIA) bring the artwork, it prints the physical object using the most exacting process available, puts your imprint on it, and never competes with you in selling the product. A wafer is a round disc of silicon (commonly 30 cm across) on which hundreds or thousands of chips are built at once. Pure-play foundry is the highest-barrier form of this business, because only one or two companies worldwide can reliably run the most advanced nodes (3 nm, 2 nm) at volume.
13.2 IDM Foundry
An IDM (integrated device manufacturer) is the all-in-one company that designs its own chips, owns the fabs that build them, and sells them itself. Consider that a pure-play foundry runs only the print works, whereas the IDM writes the book, prints it and sells it. IDM foundry refers to such a company renting out the fab capacity it has left over once its own needs are met.
13.3 Specialty / Mature Foundry
Not every chip needs the leading edge. Many chips — power management, analog, display drivers — are cheaper and more reliable when built on a slightly older, thoroughly proven node, and that is mature-node foundry. Specialty process means a process tailored to a particular class of chip (a line built specifically for analog mixed-signal work, or for MEMS microelectromechanical sensors). Consider the niche printer specialising in one kind of paper and one kind of binding: it does not chase the newest equipment, but within its own corner nobody does the job better.
13.4 Memory Fab
These are the fabs dedicated to memory, covering the two main classes: DRAM (dynamic random access memory, the computer's working desktop, wiped when power is cut) and NAND (flash, the warehouse behind a solid-state drive, which retains data without power). AI training is voracious in memory, above all the HBM high-bandwidth memory discussed later, whose substrate comes out of a DRAM fab. Consider that if the foundry builds the brain, the memory fab builds the memory.
13.5 Compound / Photonic Specialty Process
Everything above concerns chips built in silicon, but silicon is not good enough everywhere. High-voltage, high-power conversion, for instance, calls for wide-bandgap materials such as silicon carbide (SiC) and gallium nitride (GaN), which withstand high voltage at high efficiency — precisely what the rack-level high-voltage DC discussed in the electrical layer requires. The lasers in an optical module that turn electrical signal into light, similarly, must be built in compound semiconductors such as indium phosphide (InP) and gallium arsenide (GaAs). And then there is silicon photonics, which etches the optical path directly into the silicon. This item is the specialised fabs that build these non-silicon and photonic devices.
13.6 Photomask Manufacturing
Chips are built by lithography, printing the circuit pattern onto the wafer with light (covered in detail in the next layer). The photomask is the master plate carrying that circuit pattern: light passes through it onto the wafer and the pattern is reproduced. Consider the engraved face of a rubber stamp — the lithography tool is the stamping machine, the mask is the engraved face itself, and without that plate even the most expensive scanner prints nothing at all. The most advanced EUV (extreme ultraviolet) masks are exceptionally difficult to make, and the number of players worldwide can be counted on one hand.
13.7 Conventional Assembly & Test (OSAT — wirebond / flip-chip)
A finished die on the wafer is still a bare, fragile sliver with no way to be wired up; it has to be given a coat and pins before it can be used, and that step is packaging. Testing it afterwards makes the pair assembly and test. The outsourced factories that take on this work are called OSATs (outsourced semiconductor assembly and test). Wirebonding connects the die's pads to the package pins with extremely fine gold or copper wire — the most traditional method; flip-chip turns the die over and attaches it to the substrate through a grid of small solder bumps, giving denser and faster connections. Consider packaging to be dressing the chip in a coat with a great many pins, and the OSAT to be the tailor and the inspection house combined.
13.8 Wafer-Level / Fan-Out Packaging
Conventional packaging cuts the dies out first and packages them one at a time; wafer-level packaging inverts that, packaging every chip at once while they are all still attached to the wafer — more efficient and thinner. Fan-out is one technique within it: when the die itself is too small to accommodate all the pins, an extra ring of area is extended around the die for re-routing and additional connections, the way a canopy is stretched out beyond the ribs of an umbrella. Consider conventional packaging as sewing one coat at a time by hand, and fan-out as cutting and sewing in batch from a full bolt of cloth — with the option of broadening the shoulders on the smaller frames.
13.9 Advanced Packaging — 2.5D/3D
This is the single most critical and most constrained link of the AI era, and it deserves a full explanation. Transistors are approaching the limit of how much smaller they can be made, so the industry has changed tack: rather than making one chip bigger, it packs several dies (a compute die plus a ring of HBM memory) tightly together to work as one. How is that done?
2.5D: place a slab of silicon called an interposer beneath the several dies, pre-etched with extremely dense wiring, so that dies set on top can communicate at high speed. Consider seating several specialists at one table already laced with cabling, so that no conversation has to take the long way round. TSMC's signature process CoWoS (chip-on-wafer-on-substrate) belongs to this class, and it is currently one of the largest capacity bottlenecks for AI silicon — though TSMC's expansion does not map one-for-one onto NVIDIA's shipments, since HBM, substrates, yield, test, networking and power delivery are all constraining at the same time.
3D: stack the dies vertically outright. TSMC's SoIC (system on integrated chips) and Intel's Foveros both belong here.
Hybrid bonding: weld the copper pads of two dies face to face directly, with no adhesive at all — extremely high density, and the leading-edge technique for 3D stacking.
Consider that if conventional packaging dresses each chip in its own coat, advanced packaging zips a whole team into a single set of overalls so that they work shoulder to shoulder with no lag between them.
13.10 System-in-Package (SiP, Heterogeneous Integration)
SiP (system-in-package) puts an entire set of differently specialised chips (processor, memory, power, RF and so on) into one housing, so that the small box is itself a complete subsystem. Heterogeneous integration means mixing chips of different processes and different kinds into that one assembly. Consider that advanced packaging joins several compute specialists together, whereas SiP sweeps the whole project team — compute, memory, power, signalling — into a single box.
13.11 Panel-Level Packaging / CoPoS
The packaging described so far is mostly performed on a round wafer, and the round edge wastes a good deal of area. Panel-level packaging switches to a large rectangular panel — like replacing a round pizza with a rectangular tray — fitting more units per batch, wasting less material and lowering cost, which suits large and expensive AI packages particularly well. CoPoS (chip-on-panel-on-substrate) is the effort to carry the CoWoS approach across onto the rectangular panel. Consider swapping a round baking tin for a rectangular one: more loaves per bake, nothing lost at the corners.
13.12 Known-Good-Die / HBM Stack Test (KGD)
Advanced packaging is expensive, and once several dies are joined together a single bad one writes off the entire costly package. Every die must therefore be confirmed good before assembly, and a die verified in advance in this way is a KGD (known-good die). HBM memory is several layers of DRAM stacked up, and each added layer — plus the finished stack — must be tested, which is HBM stack test. Consider authenticating every piece individually before assembling a limited-edition Lego set, rather than discovering one defective brick at the end and writing off the whole box.
Start with the overall picture. The fabs of the previous layer are formidable precisely because they can afford — and know how to run — the machines this layer sells. An advanced fab is packed with hundreds of tools, each costing anywhere from several million to well over a hundred million dollars, and equipment can account for more than seventy per cent of the total investment in the plant. The economics of this layer (the industry calls it WFE, wafer fab equipment) are exceptionally clear-cut: almost every tool category is an oligopoly of one to three vendors, the technical barrier is high enough that new entrants have scarcely appeared in decades, and the closer to the leading edge, the fewer the players and the firmer the pricing power. They sell not only machines but years of service, spares and consumables — the attractive business of selling the tool once and collecting the service fee every year thereafter. What follows walks through the machines one at a time, in the order of the manufacturing flow.
14.1 Lithography (EUV/DUV)
Lithography is the most central and most expensive step in building a chip: light is passed through the photomask described above to print the circuit pattern onto a wafer coated in photosensitive material. The lithography scanner is the machine that does this, and it is the most expensive and most critical tool in the entire plant. Consider an exquisitely precise stamping machine: the mask is the engraved face, the wafer the paper, and it must print billions of features thousands of times finer than a human hair within an area the size of a fingernail. The shorter the wavelength, the finer the pattern it can print: DUV (deep ultraviolet) is the older but still dominant tier; EUV (extreme ultraviolet, shorter still) is the only route to the most advanced chips below 5 nm, and exactly one company in the world can build an EUV scanner.
14.2 Etch
Lithography only prints the pattern; etch is what actually removes the unwanted material along that pattern, carving the real trenches and structures. It divides into dry etch (bombarding the material away with a plasma, by far the most common) and wet etch (dissolving it chemically). Consider lithography as drawing the lines on a board and etch as cutting away along them, turning a flat plate into a three-dimensional structure. AI chips carry very many layers and very deep features, and etch precision determines the outcome directly.
14.3 Deposition (CVD/PVD/ALD/Epitaxy)
A chip is built up layer upon layer, and each structural layer begins with laying an extremely thin film of material onto the wafer — the deposition step. Several methods exist: CVD (chemical vapour deposition, reacting a gas at the wafer surface to grow a film); PVD (physical vapour deposition, vaporising a metal and condensing it onto the wafer, commonly for metal layers); ALD (atomic layer deposition, laying down a single atom's thickness at a time for the finest layers); and epitaxy (growing a high-quality crystalline film whose lattice matches the material beneath). Consider deposition as painting the wafer: CVD grows the film through a chemical reaction, PVD sprays it on, ALD applies it atom by atom with the finest possible brush — and etch then carves away the paint that is not wanted, the cycle repeating hundreds of times to build a chip.
14.4 Chemical Mechanical Planarisation (CMP)
Every few layers the surface of the chip becomes uneven, and it must be flattened before building can continue, or the subsequent lithography will not hold focus. CMP (chemical mechanical planarisation) softens the surface with a chemical slurry while physically polishing it with a pad, leaving the wafer as flat as a mirror. Consider levelling each floor of a building before laying the next course of bricks — CMP is the machine that pours the softening agent and grinds at the same time.
14.5 Ion Implantation
Pure silicon conducts poorly; turning it into a useful transistor requires doping — introducing small quantities of other elements to alter its conductivity. Ion implantation accelerates those dopant atoms into high-speed ions and fires them precisely into specific regions of the wafer, as at a target. Consider injecting different fillings at defined points in a piece of dough so that different parts take on different flavours — different conductivity — which is exactly how the switching behaviour of a transistor is tuned.
14.6 Thermal Processing (RTP / Diffusion Anneal)
After implant or deposition the wafer usually has to be heated to a high temperature and annealed, settling the newly implanted atoms into their correct positions, repairing the damage the bombardment caused, or growing the material into the desired structure. RTP (rapid thermal processing) ramps up and down within seconds; a diffusion furnace instead treats the wafer slowly over a long period at high temperature. Consider firing pottery in a kiln, where heat and time decide the hardness and the quality of the finished piece.
14.7 Cleaning / Surface Prep
Chips are built at nanometre scale, where a speck of dust smaller than a virus landing on the wafer can destroy the die outright, so cleaning is repeated before and after every process step. Cleaning tools flush particles and contaminants off the wafer surface with ultrapure water and chemicals. Consider that every stage of surgery is preceded by thorough sterilisation; every stage of chip manufacturing likewise washes the wafer spotless, coming and going.
14.8 Metrology / Inspection
Chips are built at an invisible nanometre scale, so dimensions must be measured and defects found continuously during manufacture, or an entire lot can be scrapped with no idea where it went wrong. Metrology measures dimensional data — line width, film thickness, whether the overlay is accurately aligned. Inspection finds particles, defects and flaws on the surface. Consider the quality inspector with a microscope at the end of the line, measuring whether each part is within tolerance while picking out the defective ones under magnification. This is the eye of yield.
14.9 Automated Test Equipment (ATE)
Once a chip is built and packaged, every unit must be powered up and exercised to check that it functions correctly and meets its performance specification. The machine that gives the chip this electrical examination is ATE (automated test equipment). It applies a range of electrical signals, reads the results back, and judges whether the part is good and how fast it can run. Consider the full medical examination every chip receives before it leaves the factory; AI chips are large and complex, so testing takes longer and demands more of the tester.
14.10 Burn-in
Some chips are good when they leave the line but fail soon after use, and these infant-mortality units must be caught before shipment. Burn-in subjects the chip to prolonged punishment at elevated temperature and voltage, forcing those destined to fail early to fail now so they can be screened out, leaving only the genuinely durable parts. Consider running a new car several thousand kilometres in extreme conditions before it leaves the plant, surfacing latent faults there rather than in the customer's hands.
14.11 Handlers / Probers
Testing requires a machine to deliver each chip precisely to the test position and then sort the tested parts into bins by result; that machine is the handler. Where the dies must be tested while still attached to the wafer, before dicing, a prober is needed to land hundreds or thousands of very fine needles simultaneously and accurately on the pads of each die to power it up and test it. Consider the handler the conveying and sorting arm on the test line, and the prober the precision hand able to hold a thousand pins down at once.
14.12 Assembly / Packaging Equipment
This is the equipment used by the packaging houses of Layer 13, including the dicing saw that cuts a wafer into individual dies, the die attach tool that bonds the die to the substrate, the wire bonder that connects the pins with fine wire, and the moulding machine that encapsulates the chip in protective compound. Consider that if the packaging house is the tailor dressing the chip in its coat, these are the shears, the sewing machine and the press.
14.13 Sub-fab Abatement / Gas Delivery
Chipmaking consumes large volumes of toxic and flammable speciality gases and chemicals, and generates hazardous exhaust, so the level beneath the cleanroom (the sub-fab) houses a complete support system: vacuum pumps (evacuating the process chambers), abatement (scrubbing hazardous exhaust to specification before release) and gas and chemical delivery cabinets (routing speciality gases safely and precisely to every tool). Consider the cleanroom the operating theatre and the sub-fab the unglamorous supply, extraction and waste system one floor below, which must never stop.
14.14 Test Sockets / Contactors / Probe Cards
Test equipment is expensive and general-purpose, but every chip has its pads in a different place, so an interface part is needed to connect the chip accurately to the tester: the probe card (the board covered in needles that lands on dies on the wafer) and the test socket (the carrier into which a packaged chip is inserted for test) are these contactors. They wear out and must be replaced on a schedule — they are consumables. Consider the tester as the diagnostic machine and the probe cards and sockets as the disposable needles and interfaces: the machine is used over and over, the contacts must be changed once they have made enough contact.
14.15 Hybrid Bonders for Advanced Packaging
The hybrid bonding described under advanced packaging — welding the copper pads of two dies face to face with no adhesive — depends on this exceptionally precise bonder, which must align two dies to within a fraction of a hair's breadth before pressing them together. It comes in wafer-to-wafer (W2W) and die-to-wafer (D2W) forms. Consider aligning two films printed with circuitry to nanometre accuracy and bonding them seamlessly: a hair out of true and the whole chip is scrap. This is the most advanced tool in advanced packaging.
14.16 Temporary Bond/Debond & Wafer Thinning
Advanced packaging frequently requires the wafer to be ground extremely thin (so that many layers can be stacked), but a wafer that thin shatters at a touch, so before processing it is temporarily bonded to a sturdy carrier for protection and released afterwards — temporary bond and debond. Grinding the wafer down is called backgrinding. Consider mounting a very thin sheet of paper on card before cutting it, then peeling it away afterwards, so that the paper does not tear the moment it moves.
14.17 Advanced Package 3D Metrology / Inspection
Advanced packaging stacks dies and buries them inside the package, where an ordinary microscope cannot see, so dedicated techniques are needed to check for internal defects: X-ray to see through to the internal solder joints, ultrasonic inspection to listen for internal voids, and metrology of the bonded interface for warpage and gaps. Consider giving the stacked chip sandwich a CT scan and an ultrasound: every layer can be examined without cutting it open.
14.18 Actinic EUV Mask / Blank Inspection
EUV, as noted, is the crux of the leading-edge node — and a single minuscule defect on the EUV photomask is copied onto every wafer, generating scrap in bulk. The difficulty is that inspecting an EUV mask is best done by illuminating it at the same wavelength EUV itself uses (actinic inspection), and essentially one company in the world can build such a tool. Consider the dedicated medical examination given to the most expensive master plate of all — where the examination machine is itself a global monopoly.
14.19 Field Service / Spares / Refurbishment
Machines worth tens of millions of dollars are not a one-off transaction: they run for years, require scheduled maintenance and replacement spares, need emergency repair on site when they fail, and can be refurbished and resold when old. Equipment vendors therefore carry a large, stable after-sales revenue stream. Consider high-end medical equipment, where the enduring business is not the sale of the CT scanner but the years of maintenance contracts, parts and upgrades that follow. This business is increasingly paired with AI defect-analysis software, which makes it more valuable still.
Take the whole AI factory apart, working upstream and downward until nothing further can be stripped away, and you arrive at this layer: the raw materials and consumables from which chips are made. The preceding layers covered the chips themselves, the equipment and the servers; this layer covers what must exist before that chip can be built at all — silicon wafers cleaned to an obsessive degree, specialised coatings that develop an image under light, gases and chemical liquids of unimprovable purity, and the packaging materials that frame and cap the die. Most of these are not large one-off capital items but consumables, a batch used up with every wafer processed and reordered once spent, which makes this the business of supplying a fab every day it is running.
Three features of this layer have to be fixed in mind first. First, it is the most severely Japan-dominated layer on the chain and the least often written about. For many critical materials only one or two Japanese companies in the world can make them, and rivals cannot copy them even with intent, because the formulation is decades of accumulated tacit knowledge written into the process. Second, it is a business in which a structural moat and an intellectual property moat (patents and proprietary formulations) are layered on top of one another: switching supplier means one to two years of requalification, so customers rarely dare to move, and pricing power is correspondingly firm. Third, and most important for investment purposes: this layer is a cyclical-cum-defensive asset, not AI high-growth beta (the elasticity that rises and falls with the AI cycle). It tracks overall semiconductor utilisation — good when semis are good, poor when they are not — and AI demand adds an increment without ever multiplying it several times over the way a GPU does. Put it this way: this is the business of selling water and sand every day alongside the shovels. Steady, but not glamorous.
What follows takes this layer's 24 components one at a time.
15.1 Silicon Wafers (Wafer Substrates)
The silicon wafer is the foundation on which a chip is built. High-purity silicon is melted, drawn into a long round single-crystal ingot, then sliced like a sausage into discs and polished to a mirror flatness. Every chip circuit is ultimately drawn onto that wafer, layer by layer. Consider the wafer the levelled plot of land a building sits on: if the ground is uneven or dirty, whatever is built on it comes out crooked. Several types are distinguished within this group: prime polished wafers (the basic mirror-finished wafer), epitaxial wafers (a further, more perfect layer of thin silicon crystal grown on the wafer, giving better electrical performance), silicon-on-insulator (SOI, with an insulating layer sandwiched inside the wafer for lower power and better noise immunity, used in high-end chips), float-zone wafers (extremely high-purity silicon for power devices) and reclaimed monitor wafers (the pacing wafers used to check tool condition, which can be reclaimed and reused).
15.2 Photoresist (including EUV Resist)
Photoresist is a specialised coating whose properties change on exposure to light. In manufacture, a layer of resist is spread evenly over the wafer, light is shone through the mask (the plate bearing the circuit pattern), and the exposed and unexposed regions end up chemically different; a wash then leaves the circuit pattern on the wafer. Consider photographic film: expose it and the image appears. The shorter the wavelength, the finer the line that can be drawn and the more advanced the chip, so resists are generationally defined by the light they serve: i-line / KrF (krypton fluoride, the older generation, drawing coarse lines), ArF dry / ArF immersion (argon fluoride, immersion adding a layer of water between lens and wafer to draw finer lines, and the mainstream for advanced nodes) and electron-beam resist (written with an electron beam rather than light, used for masks and ultra-fine patterning). The most advanced EUV resist (extreme ultraviolet, of very short wavelength, indispensable for the most advanced AI chips) is broken out separately as item 19.
15.3 Resist Ancillaries (Companion Chemicals)
Resist is not simply applied and exposed; a full set of companion chemistries is required around it. This group is those companions: developer (the liquid that washes the pattern out after exposure), anti-reflective coatings (ARC / BARC, bottom anti-reflective coating, laid beneath the resist to stop light reflecting back and blurring the pattern), topcoat (laid over the resist as protection, keeping water out during immersion lithography), adhesion promoter (so the resist grips the wafer and does not lift), edge-bead remover (washing away surplus resist at the wafer edge) and resist strip (the chemistry that cleans residual resist off once the pattern has served its purpose). Consider the resist the main dish and this group the oil, salt and seasoning: without any one of them the dish cannot be made.
15.4 Photomask Blanks
Lithography, as described, uses a plate bearing the circuit pattern; that plate is the photomask (or reticle). The mask blank is that plate before any pattern has been written: an exceptionally flat, pure quartz glass substrate with an opaque metal film already deposited, awaiting the circuit pattern from the downstream step. Consider the blank a sheet of premium photographic paper before printing: a fractional shortfall in quality and the entire batch of chips printed from it is scrap. The group divides into DUV mask blanks (for deep ultraviolet, the mainstream), EUV multilayer mask blanks (for extreme ultraviolet, requiring dozens of nanometre-scale films to be deposited, which very few in the world can do — a genuine chokepoint), phase-shift blanks (using optical interference to render a crisper pattern) and pellicles (an ultra-thin transparent membrane covering the mask to keep dust off the plate).
15.5 Wet Chemicals
Through the course of manufacture the wafer is repeatedly cleaned, etched and rinsed, and the liquid chemistries used are collectively the wet chemicals. How pure must they be? Impurities are controlled to parts per trillion, because a trace of metal contamination can destroy an entire wafer. Consider preparing an infant's formula in which one unwanted molecule in the water is one too many. The group divides by use: electronic-grade hydrofluoric acid (the strong acid that etches silicon dioxide, with the most exacting purity requirement of all), sulphuric acid / hydrogen peroxide clean (SPM, removing organic contamination), hydrochloric, nitric-phosphoric and ammonia-based cleans and etches (each removing a different contaminant or etching a different material), semiconductor solvents (for dissolution and cleaning) and metal etchants (removing surplus metal layers precisely).
15.6 Specialty Electronic Gases
Many steps in chip manufacture take place inside a sealed vacuum chamber, accomplished by flowing in particular gases — to grow a film on the wafer, say, or to etch material away. These ultra-high-purity gases are the speciality electronic gases. Consider the gas supply in a kitchen: invisible, indispensable, and without it nothing on the stove can be lit at all. The group divides into deposition gases (growing films), etch gases (etching precisely), chamber cleaning gases (clearing residue from the tool chamber), dopant gases (introducing trace impurities into silicon to alter conductivity), lithography laser gases (feeding the scanner's laser) and bulk ultrahigh-purity gases (nitrogen, hydrogen, argon and helium, consumed in very large volumes).
15.7 CMP Slurries & Pads
A chip is built up layer by layer, and each layer must be polished absolutely flat before the next can go on; that flattening step is CMP (chemical-mechanical planarisation). It etches chemically while abrading mechanically, polishing the surface to atomic-scale flatness by both means at once. The consumables here are: slurry (a suspension of extremely fine abrasive particles, in silica-based, ceria-based, metal and silicon-carbide variants for different materials), the polishing pad (the pad that carries the slurry and rotates against the wafer) and the conditioning disk (the tool that dresses the pad itself to maintain its roughness). Consider the slurry the fine grit used to mill soya, the pad the millstone, and the conditioner the tool that re-cuts the grooves in that stone.
15.8 Sputtering Targets (PVD Metal Targets)
A chip carries many layers of metal interconnect (copper, tungsten and the like) — so how is the metal deposited onto the wafer? One method is sputtering: a disc of high-purity metal serves as the target, ions bombard it, and the metal atoms knocked loose travel across and deposit on the wafer layer by layer. That bombarded disc is the sputtering target. Consider a bar of high-purity metal soap, shaved away a little at a time and spread onto the chip. Targets are classified by metal: copper and aluminium targets (main interconnect), titanium and tantalum barrier targets (laid between copper interconnect and silicon to stop copper diffusing and contaminating it), tungsten and molybdenum targets, cobalt and ruthenium advanced-interconnect targets (the new metals replacing copper at the leading edge), magnetic alloy targets (for memory) and transparent conductive oxide targets (for displays and speciality devices).
15.9 ABF Package Substrates (FCBGA Substrates)
A finished chip is a bare sliver of silicon that cannot be soldered to a circuit board directly; it has to be mounted on a base first, and that base is the package substrate. It works like a precisely engineered interchange, fanning the thousands of minute contacts on the die out layer by layer into pins that can be soldered to the motherboard. The larger and more complex the AI chip, the more demanding the substrate — which makes this a genuine bottleneck in AI packaging. At the core of the group is ABF buildup film: high-end substrates are built by stacking insulating films, and the critical one is ABF, the overwhelming majority of which is supplied worldwide by a single Japanese company (which reports its own share at above ninety per cent and is the de facto industry standard). Consider that ABF film is a proprietary sauce supplied almost exclusively by Ajinomoto, the monosodium glutamate maker, from whom essentially every high-end substrate manufacturer in the world must buy — the improbable story of a seasoning company monopolising a chip material. The group also includes organic FCBGA substrates (the mainstream high-end substrate), coreless substrates (thinner), BT resin substrates and embedded bridge substrates (such as Intel's EMIB, burying a small silicon bridge inside the substrate to link two dies).
15.10 Advanced High-Layer PCB
The PCB (printed circuit board) is what is colloquially called the motherboard or circuit board — the green board onto which chips and components are soldered and joined by copper traces. The signals in an AI server are numerous and very fast, calling not for an ordinary PCB but for an advanced board with a great many layers (dozens of copper layers stacked) and very low signal loss. The group includes high-layer-count laminate, low-loss laminate (letting high-frequency signals travel far without attenuating), HDI (high-density interconnect, with extremely fine and dense traces) and copper-clad laminate (CCL, the base raw material of a PCB — an insulating board faced with copper foil). Consider CCL the cloth from which a PCB is made and the advanced PCB the tailored suit cut from it; AI is making the tailoring specification steadily more exacting.
15.11 Lead Frames
The lead frame is a more traditional packaging skeleton: a thin metal frame, stamped or etched, holding the die at its centre with metal leads extending around it; the die is connected to those leads by fine wire, and the leads emerge outside the package to be soldered to the circuit board. Consider it a metal picture frame for the chip, with legs. The group divides into stamped lead frames (punched at high speed from a die, cheap and high-volume), etched lead frames (chemically etched to a finer geometry, for high-end use) and power package lead frames (thicker frames with better heat dissipation for power devices). It is used mainly on relatively mature chips with modest pin counts — rarely on AI main processors, but extensively in power and discrete devices.
15.12 Bonding Wire
The fine metal wire mentioned above, connecting the die to the leads, is the bonding wire. It is very much finer than a human hair (micron-scale), and a dedicated machine welds it on one strand at a time to join the pads on the die to the pins on the package. Consider it the finest wiring in the world of chips; a single package may contain hundreds or thousands of strands. By material: gold wire (the most traditional and most reliable, but expensive), copper wire (cheap, highly conductive, now the mainstream), palladium-coated copper wire (copper plated with palladium to resist oxidation, more stable) and aluminium wire (common in power devices).
15.13 Die Attach Materials
Fixing the bare die onto the package base requires a chip-specific adhesive or solder — the die attach material. It must not merely hold the die firmly but usually also conduct heat away from it and carry current through it. Consider the specialised thermally conductive adhesive used to bond a hot ceramic tile to its base. The group divides into die-attach paste (in paste form), die-attach film (a thin film, used for stacked die), solder die attach (fixing with a solder alloy, with good thermal conduction), sintered metal die attach (fixing with sintered silver or copper particles, with excellent thermal conduction, for power and high-end chips) and temporary die attach (holding the die during processing and peeling away afterwards).
15.14 Mould Compounds & Encapsulants
Once the die is attached and wired, it needs a hard shell to protect it from dust, moisture and knocks, and the raw material of that shell is the mould compound (principally epoxy resin). It softens on heating, flows into the mould around the die, and cures into a hard casing. Consider a black epoxy hard-candy shell poured over the chip and set — the black chip package we all recognise is essentially this. The group divides into epoxy mould compound (EMC, the mainstream black casing), liquid encapsulant (poured in to fill gaps), mould underfill (moulding and filling the gap beneath the die in one operation), glob-top (a bead of resin dropped over the die) and wafer-level mould compound (for moulding an entire wafer at once).
15.15 Thermal Interface Materials (TIM)
Heat generated by the die has to reach the heatsink or lid to be shed, but two solid surfaces pressed together always leave microscopic gaps, and the air in those gaps insulates and blocks the heat. Thermal interface material fills that gap, displaces the air and lets heat pass through cleanly. Consider the layer of thermal paste between chip and heatsink: without it, the chip runs a fever under a blanket. AI silicon generates startling amounts of heat, and the quality of the TIM determines directly whether the chip overheats and throttles, which makes it a critical link in AI thermal management. The group divides into thermal grease (in paste form), phase-change materials (softening under heat to conform better), gap pads (soft pads filling larger gaps), thermally conductive adhesives (conducting heat while bonding) and underfill (filling the gap between die and substrate and improving reliability).
15.16 Ceramic & Glass Package Substrates
Besides the organic (plastic-family) substrates described above, package substrates are also made from ceramic or glass, which withstand higher temperatures and higher frequencies and are more stable, for power, RF and high-reliability applications. The group divides into alumina ceramic packages (the familiar white ceramic base), aluminium nitride ceramic packages (AlN, with notably good thermal conduction, for power devices), LTCC / HTCC substrates (low- and high-temperature co-fired ceramic, firing multiple ceramic layers and their circuitry into one high-density body), glass-core package substrates (using glass as the core for flatness and signal quality, regarded as the next-generation direction for large AI chip substrates) and through-glass-via interposers (drilling glass for vertical interconnect). Consider the organic substrate a plastic chopping board and the ceramic or glass substrate a fine ceramic or toughened-glass one: harder and more durable, but dearer.
15.17 Silicon Interposer & RDL Buildup Dielectric
The most advanced AI packages — a GPU sitting alongside HBM memory, for instance — place several dies side by side on a silicon intermediary board and connect them through the extremely fine wiring on that board. This is the silicon interposer, and it is the core of advanced packaging such as TSMC's CoWoS. The group includes silicon interposer wafers (the large silicon disc that serves as the intermediary), silicon bridge dies (a small silicon bridge spanning only the seam between two dies, cheaper than a full interposer), RDL dielectric (redistribution layer dielectric, the insulating film used to draw an extra layer of wiring on the die surface, in photosensitive and non-photosensitive forms), package buildup dielectric (Ajinomoto's ABF and its like again) and temporary carrier materials (supporting ultra-thin structures during processing and released afterwards). Consider the silicon interposer the foundation of an exquisitely precise miniature interchange built for several chips at once.
15.18 Photosensitive RDL Dielectric (PSPI, PBO)
Among the redistribution-layer dielectrics of the previous group, one class is distinctive: it is itself photosensitive and can be developed like a resist, the circuit pattern exposed into it directly with light, dispensing with a separate lithography step. These are the photosensitive RDL dielectrics. Most are high-performance polymers (heat-resistant plastics) acting as insulator and imaging medium at once. The group divides into photosensitive polyimide (PSPI, the most widely used), photosensitive PBO (polybenzoxazole, a higher-performing variant), photosensitive BCB dielectric, low-temperature-cure RDL dielectric (curing at a temperature low enough not to damage adjacent materials) and wafer passivation polymers (the final protective insulating layer on the wafer surface). Consider that an ordinary dielectric must be laid down and then patterned separately, whereas the photosensitive kind is laid down and patterned by light on its own, saving a process step. It is used extensively in fan-out packaging and HBM memory stacks.
15.19 EUV Resist Ecosystem
EUV (extreme ultraviolet lithography) is the technology the most advanced AI chips must use, drawing the finest lines with very short wavelength light. But EUV resist and its companion materials are far harder to make than ordinary resist, and form a small ecosystem of their own. The group divides into chemically-amplified EUV resist (the traditional route), metal-oxide EUV resist (the newer route, with higher resolution), dry EUV resist (an entirely new deposition-based process developed jointly by ASML and Lam), EUV underlayer (laid beneath the resist to improve imaging) and EUV developer and rinse chemistry. Consider ordinary resist as conventional photographic paper and this set as the complete package of specialised chemistry and consumables formulated for the most exacting ultra-high-definition development — the barrier so high that only a handful of companies worldwide can participate.
15.20 Advanced Package Thermal Submaterials
Large AI dies run at very high power and generate fierce heat, more than ordinary TIM can handle, so advanced packaging brings in a set of specialised high-end thermal submaterials. The group divides into sintered silver (silver particles sintered into an exceptionally conductive joining layer, for top-tier heat removal), liquid-metal TIM (using a liquid metal alloy, far more conductive than grease but carrying corrosion risk), integrated heat spreader materials (IHS, the metal lid capping the die, spreading and carrying heat away), lid attach materials (the thermally conductive adhesive bonding the lid to the package), high-conductivity package underfill and vapour-chamber wick materials (the porous structure inside a vapour chamber that circulates the working fluid by capillary action). Consider this group the full set of advanced fever-reducing equipment issued to a chip running very hot indeed.
15.21 High-Purity Quartz, Quartzware & Ceramic Consumables
When a wafer is processed at high temperature inside a tool chamber, the vessels and parts that hold, surround and carry it must be made of very high-purity quartz (high-purity fused silica) or speciality ceramic, or they will out-gas impurities at temperature and contaminate the wafer. This group is those consumable chamber wares: quartz crucibles (the large bowl holding molten silicon while a single-crystal ingot is pulled, destroyed after a single use — a pure consumable), quartz process tubes and boats (the tube and rack that load and carry wafers in a furnace), quartz showerheads and viewports, high-purity process ceramic parts, and ceramic chamber rings and liners (consumables protecting the inner wall of an etch chamber, replaced on a schedule). Consider these the heat-resistant crockery and furnace lining consumed repeatedly in a fab's high-temperature ovens, replaced once worn.
15.22 Specialty Rare Gases & Critical Minerals
This group is the raw material of the raw materials: speciality gases and metal ores produced in small quantity yet sitting across critical nodes. Neon (the gas feedstock for the scanner's laser, which spiked when Ukrainian supply was cut), helium (for process and cooling, in tight global supply), krypton and xenon (rare gases used in etch and lithography), gallium and germanium feedstock (the key metals of compound semiconductors, mainly produced in China, which has used them as an export-control lever), tantalum, tungsten and molybdenum feedstock (the refractory metals behind targets and devices) and rare-earth polishing feedstock (the ceria in the CMP slurries above comes from rare earths). Consider this group the ores and gases at the very bottom of the chain: unnoticed in ordinary times, but let one source be cut off or restricted and every link above it shudders.
15.23 Wide-Bandgap SiC/GaN Substrate & Epi
Ordinary chips are built in silicon, but in power applications demanding high voltage, high current and high efficiency, silicon is not enough and two wide-bandgap semiconductors take over: silicon carbide (SiC) and gallium nitride (GaN). (Wide bandgap means the material withstands higher voltage and temperature at lower loss.) In the AI datacentre they are being drawn into the rack by the spread of high-voltage DC power delivery, where they make more efficient power devices. This group is their substrate and epitaxial feedstock: SiC substrates (silicon carbide wafers, exceptionally hard to grow and exceptionally expensive), SiC epitaxial wafers, bulk GaN substrates, GaN-on-Si epitaxial wafers (growing gallium nitride on cheap silicon to save cost), GaN-on-SiC epitaxial wafers (better performance, used in RF) and emerging gallium-oxide substrates (a newer, experimental material). Consider silicon ordinary steel and SiC/GaN the speciality alloys that tolerate higher temperature and voltage, reserved for the heavy-current work.
15.24 ALD/CVD Precursors (GAA, High-k Precursors)
As described above, films are grown on the wafer by flowing in gases, and among those gases is a distinctive, very high-end class of chemicals called precursors: compounds containing a specific metal or element which, delivered into the tool, decompose and plant that element onto the wafer precisely, layer by layer, only a few atoms thick. Consider the precursor a speciality ink cartridge for 3D printing, loaded with the atomic feedstock to be printed. The most advanced AI chips use GAA (gate-all-around, the next-generation transistor structure) and high-k metal gate (using a specialised high-dielectric material for the gate insulator), and both make severe demands of the precursor. The group divides into silicon-oxide and silicon-nitride precursors, high-k hafnium and zirconium precursors (for the high-k insulating layer), metal-gate work-function precursors, tungsten, molybdenum, cobalt and ruthenium precursors (for growing metal interconnect), selective-deposition inhibitor precursors (so the film grows only where it should) and III-V MOCVD precursors (for compound semiconductors).
This is the most upstream intellectual work on the whole chain. An AI chip carries tens of billions of transistors (the smallest switches in a circuit); no human hand can draw that, so it has to be designed, simulated and checked in dedicated software, and that software is called EDA (Electronic Design Automation). Think of EDA as the chip designer's super-CAD plus super-simulator: without it nobody designs a modern chip at all. Beyond the tools, this layer sells two further things. One is design IP — ready-made circuit blocks, already designed and verified, that you buy and drop straight into your own chip rather than building from scratch. The other is design services — if you have the idea but not the team, you outsource the entire chip to a specialist house. The economics here are outstanding. Global EDA tooling is effectively an oligopoly of three, known in the industry as the EDA big three: Synopsys (SNPS), Cadence (CDNS) and Siemens EDA (SIE.DE). What they sell is software licences at gross margins that have sat above 80 per cent for years, and once a customer has adopted their tool flow, moving off it is excruciating. This is the textbook high-margin software annuity.
16.1 Front-end Synthesis Tools (EDA synthesis / front end)
A chip designer first writes out the chip's logical function in a hardware description language (much like writing code); this is the RTL (register-transfer level, best understood as the chip's functional source code). Synthesis is the step that automatically translates that source into a real circuit diagram built out of individual logic gates (AND, OR and other elementary circuit units). Write the instruction "add these two numbers" and the synthesis tool turns it into a specific mass of circuitry and wiring. This slot also covers the checking tools that confirm the source was written correctly in the first place.
16.2 Physical Design Tools (EDA physical design)
The previous step turned function into a circuit diagram, but that diagram is still only logical connectivity: nothing has a physical position. Physical design decides where on the die each circuit element sits, how the wires run, and how to guarantee that signals arrive on time — what the industry calls place & route and timing closure (making sure a signal reaches its destination within its allotted window). It is the equivalent of planning a city: siting every building, routing every road, and still guaranteeing the delivery vans arrive punctually. This is the largest and most valuable single block in all of EDA.
16.3 Verification & Simulation Tools (EDA verification / simulation)
You cannot learn by trial and error once a chip is built — a single tape-out runs to tens of millions of dollars — so the chip has to be run over and over in software first to see whether it misbehaves. That is verification and simulation. Simulation means having software pretend to be the working chip, feeding it every kind of input and checking the outputs are right. A stricter method, formal verification, uses mathematics to prove that certain functions cannot fail. This slot also sells verification IP: ready-made verification blocks that save you writing the tests yourself.
16.4 Emulation & Prototyping (EDA emulation / prototyping)
Pure software simulation is too slow — one second of chip behaviour can take hours to compute — so the industry built dedicated hardware machines to accelerate it. These are emulators: multi-million-dollar boxes. There are also prototypes built from FPGAs (chips whose function can be rewritten repeatedly) that let software teams debug early on something close to real hardware. An emulator is, in effect, a full-scale mock-up you can test-drive before the chip itself exists.
16.5 Analogue Design & Signoff Tools (EDA analog signoff)
Most of what has been described so far is digital circuitry — nothing but ones and zeros. But a chip also carries analogue circuitry, handling continuous voltage and current signals such as power delivery and clocking, and designing it is an entirely separate discipline. The tools in this slot handle analogue schematic capture, compute the circuit's true electrical behaviour using SPICE (the standard for circuit simulation), and perform signoff — the final sign-off confirming that power and timing are within specification and the chip can be sent to manufacturing. Signoff is the building inspection before handover: nothing ships until it passes.
16.6 PCB & Package Design Tools (EDA PCB / package design)
Once the chip itself is designed it still has to be soldered onto a circuit board (the PCB, or printed circuit board — the green board inside every electronic product) and sealed into a package (the protective shell around the die that brings its pins out to the world). The tools in this slot draw the routing for boards and packages, and compute signal integrity and power integrity — making sure high-speed signals do not distort in transit and that the power supply holds steady.
16.7 Chiplet & 3D-IC Design Enablement (chiplet / 3DIC design enablement)
The most advanced AI silicon is no longer a single monolithic die but several smaller dice — each one a chiplet — assembled and stacked like Lego. This is the world of chiplets and 3D-IC (three-dimensional integrated circuits). Assembling and stacking them requires dedicated design tools to plan the job: which die goes where, how the dice talk to each other at high speed, how the heat escapes, and whether the stack will warp under its own height. It is the difference between putting up a single detached building and master-planning an interconnected complex — the complexity rises sharply.
16.8 Processor IP (processor IP)
This is the largest IP business in the layer. Processor IP means licensing out the design of a CPU, GPU or AI accelerator core: the customer pays for the blueprint and builds it into their own chip rather than designing a processor from nothing. The famous name is Arm of the United Kingdom — almost every mobile chip in the world, and a growing share of server silicon, carries a CPU core licensed from Arm. RISC-V is an open, royalty-free instruction set (the command language a chip understands) that has been challenging Arm in recent years. A processor IP company, in short, sells the blueprint for the chip's brain and collects a royalty on every unit shipped.
16.9 Interface IP (interface IP)
For a chip to talk to the outside world — to memory, to the network, to other chips — it needs interface circuitry: PCIe (the high-speed lane inside a computer that connects graphics cards and drives), Ethernet, DDR and HBM for memory, UCIe (the emerging standard for connecting chiplets), and SerDes (circuitry that converts parallel data into a high-speed serial stream and back). These interfaces are extremely hard to design and highly standardised, so designers simply buy ready-made interface IP and drop it in. In AI silicon it is worth more than anywhere else, because an AI chip's whole job is to move data at furious rates.
16.10 Memory & Foundation IP (memory / foundation IP)
Every chip needs a set of elementary building blocks inside it: on-die memory (SRAM, the fastest small-capacity memory on a chip), the standard cell library (prefabricated elementary logic gates, the standard bricks of the building), I/O libraries and so on. Every chip uses them, and each must be tuned to a specific fab's process, so they too are sold as IP. This is the builders' merchant of chip design.
16.11 Analogue, Security & AI IP (analog / security / AI IP)
This slot holds specialist function blocks of every kind: PLLs (phase-locked loops, the circuitry that generates a stable clock beat for the chip), data converters (turning analogue signals into digital and back), RoT (Root of Trust, an absolutely trusted vault circuit on the die responsible for boot verification and key handling), NPUs (neural processing units, IP cores built specifically for AI arithmetic), and the network-on-chip (NoC, the internal motorway along which the chip's blocks talk to one another).
16.12 Design Services & ASIC Houses (design services / ASIC houses)
Some companies — a cloud provider, say — want their own custom AI silicon but have no full chip design team, so they outsource the entire chip to a specialist design services firm that carries it from design all the way to hand-off for manufacture at TSMC. This is ASIC design service (an ASIC being a chip built for one specific purpose). It is what you do when you want an unusual building put up and know nothing about engineering: you appoint a main contractor and hand them the lot. Through the AI boom, the large customers designing their own silicon — Google, Amazon, Meta — all have a firm of this kind standing behind them.
16.13 Cloud EDA (cloud EDA)
Taking the EDA tools above and running them on demand in the public cloud rather than installing them on local machines, so that a design house need not own an expensive server farm and can instead rent compute when it has a large verification run to get through. This is a change in delivery model rather than a market in its own right, and it has no independent pure plays.
16.15 Multiphysics Simulation (multiphysics / thermal / SI / PI / warpage simulation)
As chips stack higher and draw more power, looking at the electrical behaviour alone is no longer enough: heat, electromagnetics, mechanical stress and warpage all have to be computed together. That is multiphysics simulation. An AI chip at full load runs blisteringly hot, and thermal expansion will lift and warp the package, so all of it has to be worked out in software in advance. The premier asset here is Ansys, now owned by Synopsys.
16.16 Electronic-Photonic Co-design (electronic-photonic co-design / CPO EDA)
AI datacentres increasingly move data using light rather than copper — light is faster and loses less — which has produced the technique of packaging optical components directly alongside the die (CPO, co-packaged optics). But electronics and photonics obey two entirely different sets of physics, so designing them together requires dedicated co-simulation tools and a photonic process design kit (PDK, effectively the design manual for the optical components).
16.20 Design-for-Test & Silicon Lifecycle IP (DFT / silicon lifecycle management IP)
Every chip has to be tested for defects once built, but you cannot put a probe on all that internal circuitry, so test circuitry must be buried in the design from the outset. This is DFT (Design for Test), within which ATPG (automatic test pattern generation) writes the examination paper the chip then has to sit. A related class of IP keeps monitoring the chip's health — temperature, ageing, performance degradation — after it has left the factory and is running inside a server; this is silicon lifecycle management (SLM). DFT is the pre-delivery inspection; SLM is the fitness tracker worn thereafter.
16.21 AI-assisted Design (AI for EDA / generative design)
Using AI to design the chip itself: machine-learning algorithms try tens of millions of place-and-route configurations automatically and find designs better than a human engineer would reach. This is a capability upgrade happening inside the EDA tools — Synopsys's DSO.ai, Cadence's Cerebrus — rather than a standalone product line.
16.22 Chiplet Marketplaces & Assembly Kits (chiplet marketplaces / ADK)
Once chips are assembled out of small dice, the industry needs a marketplace in which ready-made chiplets can be bought and sold, and a common assembly design kit (ADK) that tells you how dice from different vendors fit together and how to verify the result. It amounts to building a standard-parts store and an assembly-manual library for the chiplet era. It is still very early, and the standards are being driven largely by the chip majors and the foundries.
The machines are installed, but several thousand — or several tens of thousands — of GPUs will not cooperate on their own. An entire software stack has to direct the traffic, allocate the work and watch everything continuously. This layer is the datacentre's software brain and nervous system. It has one characteristic you must hold on to: a large part of this layer is open-source software (freely available to anyone) or tooling the cloud providers built for their own internal use and do not sell separately. So in many of the slots below you will find that there are very few investable pure plays, and that most of the field is open source or cloud-provider proprietary. What you can actually buy shares in comes down to a handful of categories: observability software, data platforms, DCIM (datacentre management software) and networking software. What follows works through the slots one at a time, and marks honestly which ones are open source or cloud-proprietary.
17.1 Container Orchestration (container orchestration / Kubernetes)
A container packages a program together with everything it needs to run into one standard box that will run on any machine. When you have thousands of such boxes to manage, you need a dispatcher that decides automatically which machine each box lands on and restarts it if it fails. That is Kubernetes (K8s in the trade, today's mainstream container orchestration system). Think of K8s as a giant logistics control centre, automatically assigning tens of thousands of parcels to the right shelf. Kubernetes itself is open source and free; listed companies make their money from enterprise editions and services built around it.
17.2 GPU Gang Scheduling (GPU gang scheduling)
Training a large model means several thousand GPUs computing in lockstep — one short and the job does not run, much as a choir has to come in together. Gang scheduling ensures that the whole batch is either allocated and starts together, or waits together; it never allows half of them to work while the other half sits idle. This is a scheduling problem peculiar to AI training.
17.3 GPU Virtualisation & Partitioning (virtualization / GPU partitioning)
An expensive GPU running a small job is badly underused. GPU partitioning divides one physical GPU in software into several slices handed to different users simultaneously without interference (MIG and vGPU in the technical vocabulary). It is the equivalent of subdividing one large office into separate lettable desks. The confidential-computing variants go further and guarantee that no tenant can see another tenant's data.
17.4 MLOps Platforms (MLOps platforms)
MLOps (machine learning operations) is the end-to-end platform for running the business of training AI models: data preparation, training, evaluation, deployment, monitoring and retraining, assembled into a production line. If writing code has its development process, training AI models needs its own factory-floor management system, and that is MLOps.
17.5 Pipeline & Workflow Orchestration (pipeline / workflow orchestration)
An AI or data job usually breaks into many steps run in sequence or in parallel — fetch the data, clean it, train, deploy. Workflow orchestration uses software to draw those steps as a dependency graph (a DAG, or directed acyclic graph — a flow chart that moves forward step by step and never loops back) and triggers each step automatically in order.
17.6 Experiment Tracking & Model Registry (experiment tracking / model registry)
Training a model means running hundreds or thousands of experiments with different parameters, which requires tooling to record the configuration and the result of each one so they can be compared — experiment tracking. The models that come out then have to be registered, versioned and attributed so they can be managed and reproduced — the model registry. Between them they are an AI team's laboratory notebook and finished-goods ledger.
17.7 Model Serving & Inference Orchestration (model serving / inference orchestration)
Once a model is trained it has to go into service so that users can call it to answer questions — that is inference. But user demand rises and falls, so software has to route each request to a suitable GPU, scale capacity up automatically at peak, and batch multiple requests together for efficiency. The whole apparatus is inference orchestration: a restaurant opening extra service windows at the lunch rush and combining like orders into a single pass through the kitchen.
17.8 Observability & Monitoring (observability / monitoring)
Once a system is running you need to know at any moment whether it is healthy, where it is slow and what is about to break. That is observability, and it rests on collecting three things: metrics (the numbers), logs (the record of events) and traces (the path a single request took through the system). It is the datacentre's full-body scanner and wall of screens. This is one of the few slots in the layer with a substantial population of listed pure plays.
17.9 AIOps Analytics (AIOps / analytics)
AIOps means using AI to run operations: algorithms that find anomalies in vast monitoring datasets, identify the root cause of a fault, predict which piece of equipment is about to fail, and in some cases remediate automatically, sparing an engineer from watching a screen. Conventional monitoring turns a light red; AIOps tells you which cable is about to part and reconnects it for you.
17.10 Cost, Capacity & FinOps Optimisation (cost / capacity / FinOps)
AI compute is brutally expensive, and monthly cloud bills run into the millions of dollars. FinOps (cloud financial operations) is the software that keeps watch on where the money goes, what is being wasted and what could be cheaper — spotting GPUs bought but never fully loaded, or a committed contract that would cost less. It is the datacentre's intelligent bookkeeping and cost-saving adviser.
17.11 DCIM (Data Center Infrastructure Management software)
DCIM is the software that manages the physical estate of a datacentre: which racks still have space, how much power and cooling headroom remains, where each piece of equipment sits, the asset register, and energy consumption. It is the building management suite of the datahall, letting an operator see the entire physical state of the site on one screen. Note that DCIM is software; the power and cooling hardware it manages belongs to Layers 5 and 6.
17.12 BMS/EPMS/SCADA Software (building, power and industrial control software)
This slot covers the control software for the building and the electricity beneath it. BMS (building management system) runs air conditioning, lighting, access control and the rest of the building plant; EPMS (electrical power monitoring system) watches the flow of power through the whole site in real time; SCADA (supervisory control and data acquisition, the general-purpose industrial platform for equipment monitoring) gathers sensor data and issues control commands. This is industrial control software that factories and office towers have used for decades, redeployed to run datahalls (the hardware being monitored sits in Layers 5 and 6).
17.13 Energy, Thermal & CFD Modelling Software (energy / thermal / CFD modeling)
Before a datahall is built, the way air will move, heat will disperse and power will flow has to be simulated on a computer. CFD (computational fluid dynamics) is the software for computing airflow and liquid flow. You blow the air through the virtual building first and see where the heat pools, rather than discovering after commissioning that one row of racks runs too hot.
17.14 Compilers, Runtimes & Kernel Libraries (compilers / runtimes / kernel libraries — the CUDA layer)
This is one of the true sources of NVIDIA's moat and is worth stating precisely. The code an AI programmer writes cannot be fed straight to a GPU; a translation layer and toolbox sits in between. The compiler turns the code into instructions the GPU can execute; the runtime schedules the GPU while the program runs; and the kernel libraries are pre-written, exhaustively optimised implementations of the common mathematical operations, matrix multiplication above all. NVIDIA bundles the lot as CUDA — best understood as the complete programming platform and toolset for NVIDIA GPUs. Every AI programmer in the world writes against CUDA, and switching to another vendor's silicon means relearning the craft. That is NVIDIA's deepest software moat. AMD's counterpart is ROCm; Intel's is oneAPI.
17.15 Data Platforms, Lakehouses & Vector Databases (data platform / lakehouse / vector DB)
AI consumes enormous quantities of data, which has to be stored and queried somewhere. The lakehouse is the modern data platform that fuses the data lake (tip everything in first) with the data warehouse (organised for querying). The vector database is a creature of the AI era: what it stores is not conventional tables but the strings of numbers — vectors — that text and images are converted into, allowing retrieval by semantic similarity. It is the key to giving a large model external memory and retrieval, known in the trade as RAG (retrieval-augmented generation). In effect, the vector database lets the AI look up the relevant material before it answers.
17.16 Networking Software, SDN & AI Fabric Management (networking software / SDN / fabric management)
Several thousand GPUs in an AI cluster are welded into one machine by an ultra-high-speed network, and that fabric has to be configured, scheduled and kept clear of congestion by software. SDN (software-defined networking) lifts the network's brain out of the hardware and puts it under centralised software control, so traffic can be re-shaped flexibly. AI fabric management then has to solve the particular problem of keeping thousands of GPUs from gridlocking the network when they all transmit at once.
17.17 Digital Twins & Live Ops Simulation (digital twin / live ops simulation)
A digital twin is an exact virtual copy of a real datahall, fed with live data from the physical site, in which an operator can simulate what happens if a given machine fails, or how much additional load would push the hall into thermal trouble, before acting. It is the flight simulator in which a pilot rehearses every emergency before taking a real aircraft up. NVIDIA's Omniverse is the flagship platform here.
17.18 GPUaaS Control Plane & Compute Brokering (GPUaaS control plane / brokering)
The neoclouds package GPU capacity and rent it out, and behind that sits a control plane managing who has rented what, how it is provisioned, how it is billed and how capacity is allocated across multiple clouds. Brokering is the business of finding a customer the cheapest GPUs with the most availability across several providers. This is the front desk and dispatch system of the GPU rental trade.
17.19 Power, Thermal & Energy Optimisation Software (power / thermal / energy optimization SW)
Using software to be intelligent about electricity and water: scheduling jobs around power prices and carbon intensity, adjusting the cooling setpoint dynamically (how cold the plant actually needs to run), and capping rack power to prevent a trip. Google famously applied AI to its cooling and cut the energy it consumed substantially. This slot is the software optimisation; the hardware being optimised sits in Layers 5 and 6.
The machines are running, and three things now have to be prevented: hackers stealing the data, the system going down, and somebody walking into the datahall to do damage — all while the site stays up every day of the year. This layer is the datacentre's security guard, fire brigade and duty engineers. Its economics are excellent. Cybersecurity is almost entirely an annual-subscription software business with high renewal rates and gross margins habitually in the 70–80 per cent range, making it one of the steadiest annuity cash flows on the entire chain. The layer is also densely populated with listed pure plays — the easiest layer on the chain for a private investor to actually buy. What follows takes it slot by slot.
18.1 Network & Infrastructure Security (network / infra cybersecurity)
This is cybersecurity in its most classical form: the firewall (the gatekeeper that blocks bad traffic at the network's entrance), DDoS protection (against a distributed denial-of-service attack, in which an attacker floods your site with junk requests until it collapses), endpoint protection (keeping each individual server and machine from being compromised), and SASE (networking and security packaged as a cloud service so users connect securely from anywhere). Together they are the city wall, the gatekeeper and the patrol of the datacentre network.
18.2 Identity & Access Management (identity / access management, IAM)
IAM governs who gets in and what they are allowed to touch: the credentials and multi-factor authentication employees log in with, special protection for the highest-privilege accounts such as administrators (PAM, privileged access management), and the governance that keeps identities compliant. Zero trust is the organising idea of this slot: trust nobody by default, re-verify identity on every access, and stop waving people through merely because they are inside the corporate network. Zero trust means badging in at every door in the building rather than roaming freely once past the lobby.
18.3 Cloud & Application Security (cloud / application security)
With the business moved onto the cloud, the cloud environment needs protecting in its own right. CSPM (cloud security posture management) checks cloud configuration automatically for holes — a storage bucket accidentally left open to the whole internet, say. CNAPP is the full cloud-native application protection platform. Alongside them sit tools built specifically to protect containers, Kubernetes and data held in the cloud. Call it the complete burglar alarm and safety inspection for a house you rent in the cloud.
18.4 Security Operations Centre (SOC / SIEM / XDR)
The SOC (security operations centre) is the enterprise's security control room, a team plus a system watching around the clock for attacks. SIEM (security information and event management) is its core software: it aggregates security logs from everywhere in the company and surfaces the suspicious patterns automatically. XDR (extended detection and response) joins up threat signals from endpoints, the network and the cloud so that a detection in one place triggers a coordinated response everywhere. SOAR (security orchestration, automation and response) then runs the remediation playbook automatically once a threat is found. The SOC is the security command centre, SIEM its wall of monitors, and XDR the system that puts every camera on one network.
18.5 Managed Security Services (managed security services, MSSP)
Many companies cannot build a security team of their own, so they outsource monitoring, threat response and compliance to a specialist firm running the job 24/7. That firm is an MSSP (managed security services provider) — the equivalent of a residential block contracting a professional security company rather than hiring its own guards. This slot contains security software companies alongside large IT services firms and telecom operators.
18.6 Physical Security & Access Control (physical security / access control)
Everything above defends against the hacker online; this slot defends against the intruder on site: surveillance cameras, access control (badge or fingerprint to enter the hall), biometrics for identity verification, perimeter intrusion detection that raises the alarm if the fence is climbed, visitor management and the security control room. With that much expensive silicon inside, physical protection matters just as much.
18.7 Managed Datacentre Services & Remote Hands (managed DC services / remote hands)
A customer's equipment sits in somebody else's facility (colocation) but the customer is not on site, so the facility's staff have to act on their behalf: reboot a machine, plug or unplug a cable, install a drive. That is remote hands. The more skilled version of the same service is smart hands. The slot also covers the NOC (network operations centre, the shift room watching the network around the clock), racking and de-racking equipment, and cabling. It is, in short, the facility doing the physical work on your behalf.
18.8 Datacentre O&M and Field Operations (DC O&M / field operations)
Behind a facility that runs every day of the year stands a professional operations team performing preventive maintenance (servicing on a schedule, before anything fails) and predictive maintenance (using sensors to catch equipment on its way to failure), emergency repairs on critical plant, spares management, shift cover and energy operations. This is the AI factory's building management, electricians and shift supervisors.
18.9 Disaster Recovery & Business Continuity (disaster recovery / business continuity)
If the facility catches fire, is attacked or goes down, the data must not be lost and the business must not stop. This slot covers regular data backup, second-scale switchover to standby systems when something breaks (failover), and the isolated vault that defends against ransomware by keeping backups somewhere the malware cannot reach. The AI era adds one more requirement: training a large model runs for weeks, and an interruption partway through cannot mean starting over, so the run has to be saved and resumed (checkpoint-restart). Think of it as the datacentre's full insurance policy plus a save function.
18.10 Compliance & Risk Management (compliance / risk management, GRC)
Large institutions have to satisfy a mass of regulation — data protection, industry codes — and be ready for audit at any time. GRC (governance, risk and compliance) is the software that holds those rules, risks and audit evidence together, checking automatically whether anything has crossed a line and collecting the evidence as it goes. It is the corporate compliance officer plus an audit file that is always ready.
18.11 Confidential Computing & GPU Trusted Execution (confidential computing / GPU TEE)
Data can be encrypted at rest and in transit, but at the moment it is actually being computed it is usually in the clear — and that is a hole. Confidential computing keeps data encrypted in hardware even while it is being processed, so that not even the cloud provider can see it. The hardware that delivers this is the TEE (trusted execution environment, a compartment on the die that outsiders cannot see into under any circumstances). It matters particularly in AI, because nobody is comfortable putting an expensive model and sensitive data onto somebody else's GPU. NVIDIA's latest GPU generations have the capability built in.
18.12 Remote Supply Chain & Runtime Attestation (remote supply chain attestation)
A server leaves the factory, travels to the facility, is installed and starts running — but has anyone tampered with it along the way, or planted a back door? Attestation is the use of cryptography at each step to verify that the device and its firmware really are genuine and unaltered. It amounts to issuing every machine a tamper-evident certificate of provenance covering the whole journey.
18.13 Firmware & BMC Security Resiliency (firmware / BMC security resiliency)
Firmware is the low-level code written directly into the hardware and the first thing to run at power-on. Compromise it and antivirus software cannot help you, because firmware sits beneath the operating system. The BMC (baseboard management controller) is a separate small chip inside a server that allows it to be managed remotely even while the host is powered down — which makes it a prize target in its own right. This slot exists to make sure boot firmware is trustworthy (secure boot), that tampering is automatically recovered from, and that vulnerabilities are patched promptly.
18.14 Encryption, Key Management & HSM (encryption / key management / HSM / KMS)
The security of encrypted data rests entirely on the key not being stolen. KMS (key management service) generates, stores and rotates those keys securely. The HSM (hardware security module) is a tamper-resistant, tamper-evident safe in hardware: the keys live inside it, nobody can extract them, and prising it open destroys the contents. If encryption is the lock on a safe, the HSM is the key room — unpickable, and buried in a bunker.
18.15 Post-Quantum Cryptography Migration (post-quantum crypto migration, PQC)
Once quantum computers mature they may be able to break almost all of today's encryption. Post-quantum cryptography (PQC) is the new generation of algorithms designed to resist that. Migrating to it is a substantial undertaking: first you have to find every piece of legacy cryptography in use across the organisation (the CBOM, or cryptographic bill of materials — essentially an inventory of every lock in the building), then replace it algorithm by algorithm. It is fitting every door in advance with a lock that cannot be picked in the future. The field is still early, but the large institutions have already begun to position for it.
18.16 Zero-Trust Microsegmentation (zero trust microsegmentation for clusters)
On a traditional network, an attacker who gets inside can move sideways at will. Microsegmentation divides the internal network into small compartments, requires authentication for traffic between them, and so confines an attacker who breaches one compartment to that compartment. It matters especially for AI clusters, where the east-west traffic between thousands of GPUs (server-to-server communication) also has to be controlled. It is the difference between a warehouse subdivided into countless locked rooms and one open floor you can walk straight across.
18.17 AI Security Posture Management (AI security posture management, AI-SPM / AI-BOM)
AI has itself become something that is attacked and must be governed. AI-SPM inventories which models and datasets a company is actually using and where the risk exposure lies, and keeps checking. AI-BOM (AI bill of materials) lists the models, datasets and components that go into a given AI system, so that problems can be traced to their source. Between them they are a register and a health record for every AI application in the organisation. This is a new and fast-growing niche.
18.18 AI Runtime Guardrails & Agentic Security (AI runtime guardrails / agentic security)
Once a large model is in service, people will try to talk it into disclosing things or doing harm. Guardrails put a filter on the model's inputs and outputs, blocking malicious prompts and stopping content that should not be produced. Prompt injection defence deals specifically with carefully crafted language used to trick a model into exceeding its authority. And once AI becomes an agent — able to call tools and carry out multi-step tasks on its own initiative — its identity and permissions have to be constrained and everything it does has to be audited. This is the hard hat, staff badge and body camera for an AI that acts.
18.19 OT & Cyber-Physical Facility Security (OT / CPS facility security)
The industrial control equipment that runs power and cooling inside the facility — BMS, PDUs, UPS, the cooling plant — is also networked, and can also be attacked. A successful attack could simply switch off the power or the cooling for an entire site, with catastrophic results. OT security (operational technology being the systems that control physical equipment, as distinct from the IT that runs the office computers) exists to protect that equipment: inventorying what is connected, monitoring the industrial network and managing its vulnerabilities. It is the last line of defence against an attacker who is not interested in stealing data and simply wants to pull the switch.